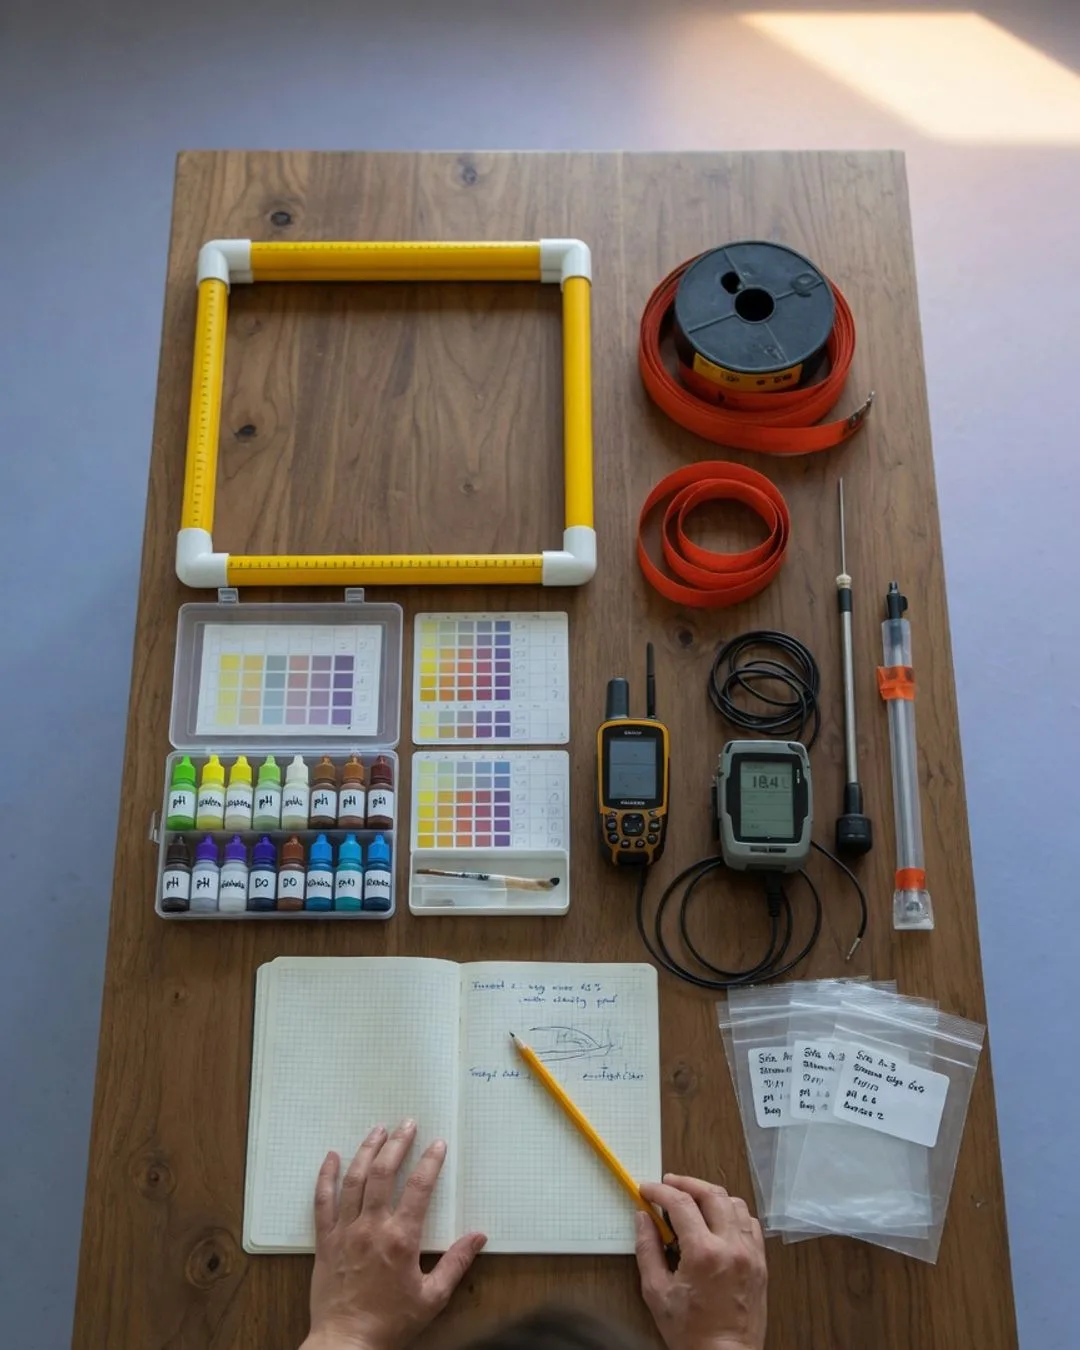
Hand a beginner a digital water-quality meter and they will copy down every digit it shows, all the way to the last flickering one, and call it the truth. Hand an environmental scientist the same meter and they will tell you which of those digits mean something and which are noise, and they will know the difference because they understand that every instrument has a limit, and reporting past that limit is a kind of lie.
Learning to measure honestly is one of the quiet, foundational skills of the whole course, and it is worth slowing down to assess on its own. It is not glamorous. It does not produce a dramatic reading or a crash. But a student who cannot measure cannot do environmental science, because every result downstream (every population estimate, every pollutant concentration, every trend line) inherits the quality of the numbers it was built from.
Significant figures are an honesty system
Students often treat significant figures as an arbitrary rule about how many digits to keep, a hoop to jump through to avoid losing points. They are nothing of the kind. Significant figures are a language for stating how much you actually know. When you write 8.4 mg/L, you are claiming the first two digits are certain and the last one is your best estimate against the meter's resolution. Write 8.4000 and you are claiming a precision your instrument never had — you are reporting confidence you do not possess. The rule for carrying sig figs through a calculation is just the bookkeeping that keeps that honesty intact: a result can be no more precise than the least precise measurement that went into it.
Precision is not accuracy
The two words get used interchangeably in ordinary speech, and the field exists in part to teach the student that they are not the same thing at all:
- Precision is how tightly your repeated measurements agree with each other. Three readings that all land within a hundredth of a milligram per liter are precise — even if every one of them is wrong.
- Accuracy is how close you are to the true value. You can be accurate on average and sloppy reading-to-reading, or precise and consistently biased.
- The hard cases are the dangerous ones: data that is beautifully precise and quietly inaccurate, because a miscalibrated meter or a systematic sampling error is repeating the same mistake with great reliability.
A student who internalizes this stops trusting a number just because the readings agreed, and starts asking the better question: agree with what, and compared to what?
Reading the instrument, and where error comes from
Some of this is muscle: calibrating a probe against a known standard so it doesn't add a phantom drift, reading the meter to the right number of places, knowing that the last digit is always an estimate. But the deeper lesson is that error propagates. A small uncertainty in a plot count and a small uncertainty in the area you sampled do not stay small and separate when you combine them — they travel into the final answer and, depending on the arithmetic, sometimes grow. A serious result names that combined uncertainty. It says, in effect, "here is my number, and here is how far from it the truth might reasonably lie."
A measurement reported without its uncertainty is not a careful number. It is a guess wearing the costume of one.
Doing it right when the clock is running
It is one thing to read a meter carefully with all afternoon to do it. It is another to do it correctly during a timed field session, when the tide is turning or the light is fading and the next site is waiting. That is deliberate. In the real practice of environmental science, measurement always happens under some pressure, and precision that evaporates the moment things speed up was never really owned. So the course asks students to measure well and measure promptly, not because speed is the point, but because a skill you can only perform slowly and undisturbed is a skill you only half-have.