Unit 08 · Ecology
Use the ecology learning pathway for original readings, models, supplied data, checked practice and fresh transfer. The five science criteria stay distinct from integration; a paper/data alternative does not certify an unobserved technique.
Student learning: Ecology
Choose the level by readiness, not age alone, and record it before instruction. Foundation, core, and honors tasks are study pathways, not an AP course or a promise of college credit. The instructor retains practical assessment and the published science rubric; integration is reported separately.
Prerequisites: Matter/energy pathways, means/variation, percentages and experimental versus observational comparisons. Honors uses squared proportions, explicit discrete growth and uncertainty bounds.
Suggested sequence: read and discuss the explanation; attempt the worked model; analyze the data at your selected level; check the answers; then complete the source-linked response and a fresh transfer question. These activities supplement, not replace, supervised practical work and the full-year schedule.
Assigned reading and focus
- OpenStax Biology 2e (2018), 46.2 Energy Flow through Ecosystems. [energy-matter-ledgers] Read GPP/NPP, trophic transfer and the distinction between biomass stocks and energy-production rates.
- OpenStax Biology 2e (2018), 46.3 Biogeochemical Cycles. [energy-matter-ledgers] Trace carbon, nitrogen and water reservoirs/processes; name biological and physical routes rather than drawing one generic cycle.
- OpenStax Biology 2e (2018), 45.1 Population Demography. [population-sampling] Compare quadrat, transect and mark-recapture approaches; state the sampling frame and closed-population assumptions.
- OpenStax Biology 2e (2018), 45.3 Environmental Limits to Population Growth. [population-sampling] Compare exponential and logistic growth; distinguish the continuous model from this explicit one-step approximation.
- OpenStax Biology 2e (2018), 45.4 Population Dynamics and Regulation. [population-sampling] Distinguish density-dependent feedback from density-independent disturbances; carrying capacity can change with conditions.
- OpenStax Biology 2e (2018), 45.7 Behavioral Biology. [community-change] Compare environmental cues and behavior that can affect survival/reproduction; distinguish individual responses from inherited population change.
- OpenStax Biology 2e (2018), 45.6 Community Ecology. [community-change] Compare competition, predation, mutualism, commensalism and parasitism; identify indirect effects.
- OpenStax Biology 2e (2018), 47.1 The Biodiversity Crisis. [community-change] Distinguish richness, evenness and genetic/ecosystem diversity; an index is not the whole meaning of biodiversity.
- OpenStax Biology 2e (2018), 47.3 Threats to Biodiversity. [community-change] Read habitat loss, invasive species and human-driven environmental change; separate a plausible mechanism from measured causation.
- CDC MMWR (2004): 150th Anniversary of John Snow and the Pump Handle. [community-change] Read the historical evidence summary and dated public-health context. A map or rate comparison can support a hypothesis without proving the entire causal chain.
- USGS: Ecological and geological responses to the 1980 Mount St. Helens eruption. [physical-disturbance] Read the USGS abstract on disturbance zones, survivor legacies and recovery after Mount St. Helens. It reports a complex history, not uniform destruction of all life.
- NOAA: What are El Niño and La Niña?. [physical-disturbance] Read how weakened upwelling changes nutrients and marine food webs during El Niño; distinguish the mechanism from a particular two-row classroom record.
Learn the science
[energy-matter-ledgers] Food-web arrows run from resource to consumer. Autotrophs build organic molecules using light or chemical energy; heterotrophs use organic resources. Gross primary production minus producer respiration gives net primary production. Production per area per year is a flux, not a standing biomass stock.
[energy-matter-ledgers] Transfer efficiency is receiving-level production divided by supplying-level production over compatible time/area units. About 10% transfer is an approximate teaching model, not a universal constant; respiration, uneaten tissue and waste affect the ratio. Energy remains conserved while usable energy dissipates as heat.
[energy-matter-ledgers] Carbon moves through atmospheric CO₂, organic matter, dissolved inorganic carbon and long-lived rock/fuel reservoirs by photosynthesis, respiration, decomposition, exchange and combustion. Nitrogen fixation brings N₂ into reactive forms; assimilation, ammonification, nitrification and denitrification connect soil, organisms and atmosphere.
[energy-matter-ledgers] Water moves among ocean, atmosphere, surface water, groundwater and organisms through evaporation, transpiration, condensation, precipitation, runoff and infiltration. These carbon, nitrogen, and water cycles share biological links but are not the same process. A box balance is final stock = initial stock + inputs − outputs with consistent units and an explicit boundary.
[population-sampling] Density is count divided by sampled area. Place quadrats randomly within a defined accessible frame or use an explicit stratified design, not only where plants look abundant. A repeated count in one square checks observation consistency, not an additional independent plot.
[population-sampling] For this one-year discrete model, Nnext = N + rN for unconstrained growth and Nnext = N + rN(1 − N/K) for logistic-limited growth. It is a small-step approximation to continuous growth, not an identity for every time interval. K changes with resources and habitat; at N above K the logistic increment is negative in this model.
[population-sampling] A paper recapture estimate N ≈ M × C/R assumes a closed population, mixing, equal capture probability and persistent recognizable marks. Zero recaptures makes this estimator undefined, not an infinite observed population. No animal capture is directed.
[community-change] Responses to light, chemical cues, moisture or other organisms can change behavior and affect survival/reproduction. The fictional choice counts below compare short-term behavior, not genetic adaptation. Independent individuals and side-reversed arenas would help distinguish preference from location bias.
[community-change] Competition can reduce both partners’ performance, predation/parasitism benefits one at another’s expense, mutualism benefits both and commensalism benefits one without a detected effect on the other. The sign depends on the measured context, not a moral category. Removing one species can change indirect interactions as well as direct links.
[community-change] This lesson defines Simpson diversity as 1 − Σpi² using observed proportions and a with-replacement convention. Higher values mean more diversity under this definition, but other books use the opposite index Σpi². Equal richness can have different evenness; sampling effort and identification resolution must match.
[community-change] The nutrient/O₂ comparison is observational. An increased nutrient input could promote producer growth and later decomposition/oxygen demand, but flow, temperature and other differences can confound a site comparison. A before/after comparison with a matched control helps, but does not magically remove every confounder.
[community-change] Habitat simplification and invasive species can alter competitive interactions and reduce diversity or resilience. These mechanisms are plausible, not a claim that any observed low index proves a specific invasive cause. Human-impact evaluation needs scale, denominator and comparison evidence.
[physical-disturbance] Physical disturbances change environmental conditions and resource pathways; their biological consequences depend on exposure, surviving organisms, refugia, seed banks, colonization and other processes. A disturbance does not reset every location to the same state.
[physical-disturbance] Before-after differences retain the same response unit. Plant cover measured in percent yields a change in percentage points, not automatically a percent relative change. Comparing reference plots can expose broader trends but does not turn a nonrandom survey into a randomized causal experiment.
[physical-disturbance] In the NOAA explanation, weakened upwelling can reduce nutrient supply and phytoplankton, affecting consumers. The supplied ocean comparison is synthetic and cannot separate all temperature, circulation, nutrient and sampling effects.

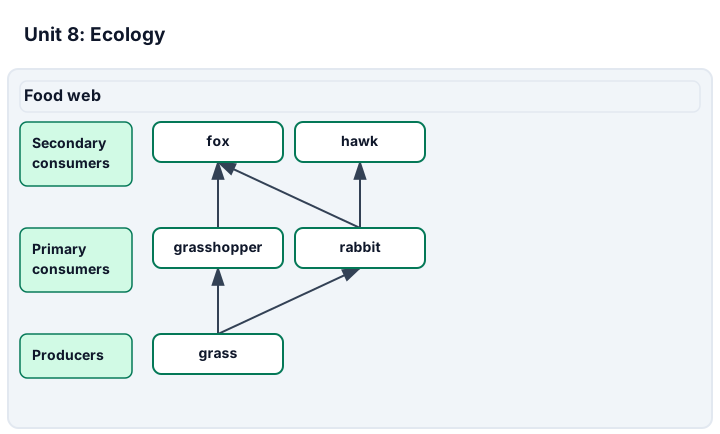
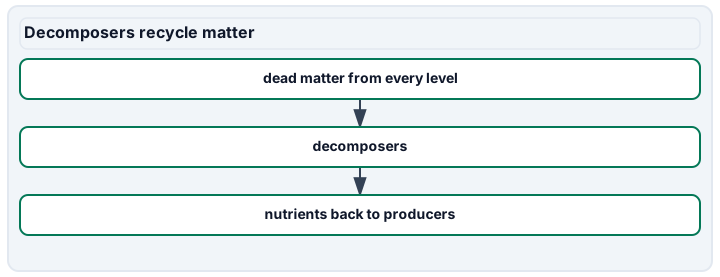
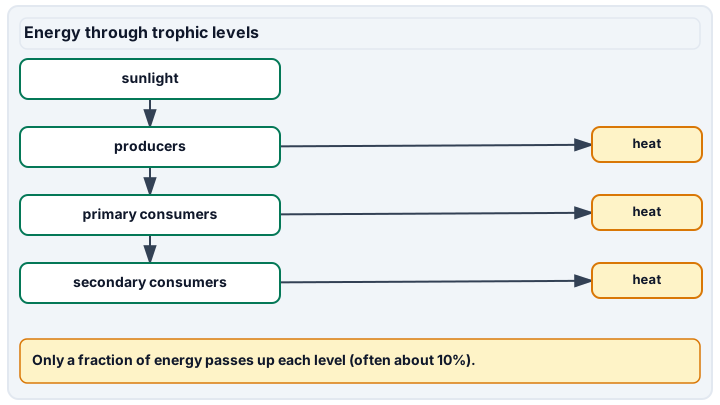
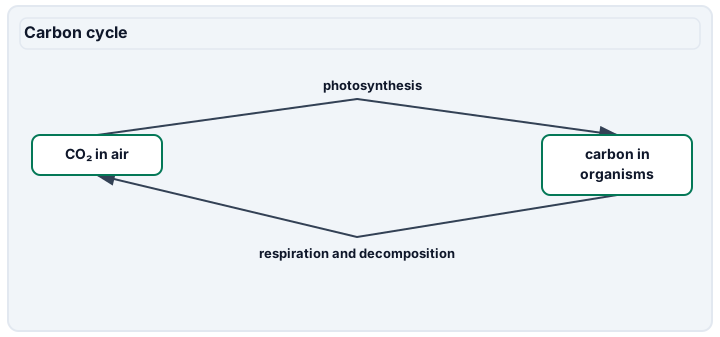
Diagram description
Food web arrows show eaten organisms to eaters: grass to grasshopper and rabbit; grasshopper to fox; rabbit to fox and hawk. Decomposers recycle dead matter from every level into nutrients back to producers. Energy flows from sunlight to producers to primary consumers to secondary consumers, with heat output. The carbon cycle has CO₂ in air and carbon in organisms as pools; photosynthesis moves carbon from air to organisms, and respiration and decomposition return carbon to CO₂ in air.
Data, provenance, and assumptions
| GPP | Producer respiration | Herbivore production | Carnivore production |
|---|---|---|---|
| 20000 | 12000 | 1200 | 180 |
| Reservoir | Initial stock | Inputs during year | Outputs during year |
|---|---|---|---|
| Carbon | 1000 | 300 | 250 |
| Nitrogen | 40 | 12 | 9 |
| Water | 200 | 900 | 850 |
| Plot | Area (m²) | Plant count |
|---|---|---|
| A | 0.5 | 3 |
| B | 0.5 | 5 |
| C | 0.5 | 7 |
| D | 0.5 | 9 |
| Initial N | Capacity K | r per year |
|---|---|---|
| 100 | 500 | 0.2 |
| M | C | R |
|---|---|---|
| 20 | 30 | 6 |
| Taxon | Site A count | Site B count |
|---|---|---|
| Grass | 5 | 14 |
| Clover | 5 | 2 |
| Daisy | 5 | 2 |
| Moss | 5 | 2 |
| Chosen condition | Count |
|---|---|
| Moist shelter | 14 |
| Dry shelter | 6 |
| Site | Nitrate (mg/L) | Dissolved O₂ (mg/L) |
|---|---|---|
| Upstream | 1 | 8 |
| Downstream | 4 | 5 |
| Plot | Before cover (%) | After cover (%) |
|---|---|---|
| Ash A | 70 | 20 |
| Ash B | 60 | 25 |
| Ash C | 80 | 30 |
| Reference A | 70 | 65 |
| Reference B | 60 | 55 |
| Reference C | 80 | 78 |
| Condition | Surface temperature (C) | Nutrient index | Phytoplankton index |
|---|---|---|---|
| Normal upwelling | 18 | 10 | 8 |
| Warm weak upwelling | 22 | 4 | 3 |
Worked model
[energy-matter-ledgers] NPP = 20000 − 12000 = 8000 kJ/m²/year. Herbivore transfer is 1200/8000 = 15%; carnivore transfer is 180/1200 = 15%; combined transfer is 2.25%, not 30%. Final ledger stocks are 1050 kg C, 43 kg N and 250 mm water, with the specified boundaries. [population-sampling] Four quadrats cover 2 m² and contain 24 plants, giving density 12/m². Mean count per quadrat is 6 with sample SD √(20/3) ≈ 2.581989 plants per 0.5 m². Exponential next N is 120; logistic next N is 116. The paper recapture estimate is 20 × 30/6 = 100 tokens. [community-change] Both sites have richness 4. Site A diversity is 1 − 4(0.25²) = 0.75; Site B is 1 − (0.7² + 3 × 0.1²) = 0.48. Moist-choice fraction is 14/20 = 0.7, not a population certainty. Downstream nitrate is 3 mg/L higher and oxygen 3 mg/L lower; association is not proof that nitrate caused the oxygen difference. [physical-disturbance] Ash-plot changes are -50, -35 and -50 percentage points, averaging -45. Reference changes average -4 points, giving a reference-adjusted difference of -41 points. The phytoplankton index drops from 8 to 3, a 62.5% decrease relative to 8. Neither arithmetic result by itself isolates one cause.
Numerical calibration
- 8000 kJ/m²/year
- 15 %
- 15 %
- 2.25 %
- 1050 kg C
- 43 kg N
- 250 mm water over the plot
- 12 plants/m²
- 2.581989 sample SD of counts per 0.5 m² quadrat
- 116 model individuals after one year
- 120 model individuals after one year
- 100 tokens, model estimate
- 0.75 1 − Σpi², with replacement
- 0.48 1 − Σpi², with replacement
- 0.7 sample first-choice fraction
- -45 percentage points
- -41 percentage points
- 62.5 percent relative decrease
Attempt the assigned level
Try the tasks before reading the calibration. These are practice answers, not a secure examination; use a new dataset or changed assumption for the assessed transfer.
Foundation: typically grades 7-8
- [energy-matter-ledgers] Use production-budget to calculate NPP and draw a resource-to-consumer chain with decomposers. Reconcile the three matter-budgets rows without adding unlike units together. Evidence: science criteria 1, 2; AP-connection objectives 8.2.A, 8.2.B, 8.2.D (selected task connection, not full objective mastery).
- [population-sampling] Use quadrat-plants to calculate total area, total count and density. Explain why recounting plot A three times does not turn the design into six independently placed plots. Evidence: science criteria 3, 5; AP-connection objectives 8.3.A (selected task connection, not full objective mastery).
- [community-change] Compare community richness, calculate moist-choice fraction and propose a survival/reproduction benefit of moisture response. Distinguish that hypothesis from measured fitness and inherited population evolution. Evidence: science criteria 3, 4, 5; AP-connection objectives 8.1.A, 8.1.B, 8.5.A (selected task connection, not full objective mastery).
- [physical-disturbance] Describe the cover changes and the ocean contrast, naming a geological and a meteorological driver without claiming the tables are field observations. Evidence: science criteria 4, 5; AP-connection objectives 8.7.D (selected task connection, not full objective mastery).
Check after your attempt
- [energy-matter-ledgers] NPP is 8000 kJ/m²/year. Arrows point toward consumers; decomposers recycle matter and also respire. Final stocks are 1050 kg C, 43 kg N and 250 mm water. Kilograms of different elements and millimetres of water are not one combined numerical stock.
- [population-sampling] Area is 2 m², total count 24 and density 12 plants/m². Recounts share the same location and organisms, so they check counting consistency, not independent ecological sampling.
- [community-change] Both sites have four taxa, but B is grass-dominated; moist choices are 14/20 = 0.7. Reduced water loss could improve survival/reproduction, but the choice record does not measure fitness. Behavior is an individual response; inherited population change requires generational genetic evidence.
- [physical-disturbance] Cover decreases more in the synthetic ash plots; the warm weak-upwelling example has less nutrient and phytoplankton index. Volcanic disturbance and ENSO-related circulation are different physical drivers whose consequences depend on context.
High-school core: typically grades 9-10
- [energy-matter-ledgers] Calculate both transfers and their combined efficiency. Predict consumer production if NPP halves with both efficiencies fixed, then trace carbon, nitrogen and water routes. Why cannot biomass replace the production denominator? Evidence: science criteria 1, 2, 5; AP-connection objectives 8.2.B, 8.2.C, 8.2.D (selected task connection, not full objective mastery).
- [population-sampling] Compute one exponential and one logistic step from growth-start, then estimate the paper-recapture population and state the closure/mixing assumption. Sketch the difference between sustained exponential growth and density limitation. Evidence: science criteria 3, 5; AP-connection objectives 8.3.A, 8.4.A (selected task connection, not full objective mastery).
- [community-change] Calculate both diversity indices with the stated formula, interpret stream-comparison cautiously and give a testable community mechanism for adding a strong competitor or removing a predator. Evidence: science criteria 2, 4, 5; AP-connection objectives 8.5.A, 8.5.B, 8.6.B, 8.7.B (selected task connection, not full objective mastery).
- [physical-disturbance] Compute group mean cover changes, their adjusted difference, and the relative phytoplankton decline. Label percentage points versus percent change. Evidence: science criteria 4, 5; AP-connection objectives 8.7.D (selected task connection, not full objective mastery).
Check after your attempt
- [energy-matter-ledgers] Transfers are 15% each and 2.25% combined. Halving NPP to 4000 gives modeled herbivore/carnivore production 600/90 under fixed efficiencies, reducing available consumer production. Carbon is fixed/respired; nitrogen fixed, assimilated and returned by decomposition/denitrification; water cycles through precipitation and evapotranspiration. Stocks lack the rate denominator.
- [population-sampling] One-step results are 120 and 116. Paper recapture estimates 100 under closure, mixing, equal capture probability and persistent marks. Exponential per-capita growth stays constant; logistic feedback reduces it toward K under fixed conditions.
- [community-change] Diversity values are 0.75 and 0.48 despite equal richness. Nitrate/O₂ differ by +3/−3 mg/L, but temperature/flow can confound the pattern. An added competitor might reduce another producer’s resource access; predator loss might increase herbivory. Both require comparable observations rather than automatic conclusions.
- [physical-disturbance] The ash mean change is -45 percentage points and reference -4, so the adjusted difference is -41 points. Phytoplankton declines 62.5% relative to the initial index; the units and denominator answer different questions.
Honors extension: typically grades 11-12
- [energy-matter-ledgers] If carbon input is uncertain by ±20 kg and output by ±10 kg with initial stock fixed, bound the final carbon stock. Explain why this is a worst-case bound rather than a statistical confidence interval. Evidence: science criteria 1, 2, 5; AP-connection objectives 8.2.B (selected task connection, not full objective mastery).
- [population-sampling] Compute quadrat count sample SD, propose stratified sampling for two unequal habitat areas, and explain why recapture with R = 0 or a large discrete growth step cannot be interpreted by blindly applying the given formulas. Evidence: science criteria 3, 5; AP-connection objectives 8.3.A, 8.4.A (selected task connection, not full objective mastery).
- [community-change] Design a matched, replicated comparison that could challenge the nutrient–oxygen explanation and assess whether the diversity contrast alone proves ecosystem resilience. Use the behavioral sample to identify a pseudoreplication risk. Evidence: science criteria 3, 4, 5; AP-connection objectives 8.1.B, 8.6.A, 8.6.B, 8.7.C (selected task connection, not full objective mastery).
- [physical-disturbance] Explain why the reference adjustment and plausible upwelling mechanism do not establish a unique cause from these synthetic records. Propose discriminating follow-up evidence. Evidence: science criteria 4, 5; AP-connection objectives 8.7.D (selected task connection, not full objective mastery).
Check after your attempt
- [energy-matter-ledgers] Lowest final stock is 1000 + 280 − 260 = 1020 kg; highest is 1000 + 320 − 240 = 1080 kg. Extremes were combined without a probability model, so this is a worst-case range, not a confidence interval or evidence that each endpoint is equally likely.
- [population-sampling] Sample SD is about 2.581989 plants per 0.5 m². Estimate density within each stratum and combine using area weights, not equal weighting unless areas match. With R = 0 the recapture estimate is undefined; large time steps can make a discrete approximation misleading or unstable.
- [community-change] Compare replicated matched sites through comparable periods, measure flow/temperature and retain pre-change/control data where feasible; this improves inference but leaves possible unmeasured confounding. Diversity may support response variety, but resilience must be measured after defined disturbance. Repeated choices by one organism are not independent individuals.
- [physical-disturbance] Plot exposure was not randomized and confounding soil, topography or baseline trends may remain. The two ocean states change several variables together. Independent repeated measurements and matched spatial/time context would help test mechanisms rather than assume causality.
History, reading, and writing connection
Read the CDC historical cholera account and compare its evidence types with our fictional community/stream data. A map cluster lacks a population-at-risk denominator and does not establish a cause by itself. Explain which comparisons strengthen a hypothesis and what alternatives remain; no personal health data is used.
Write in your own words or use an approved accessible equivalent. Cite a specific assigned section or figure, identify its evidence, and state one limitation or counterargument. Use the AI practice contract only for permitted coaching, never to invent observations or write the assessed response.
Transfer to a new case
[energy-matter-ledgers] A new synthetic system has GPP 15000, producer respiration 9000, herbivore production 600 and carnivore production 90 kJ/m²/year. Calculate NPP and both transfer efficiencies; does a non-10% value violate conservation? [population-sampling] Fresh synthetic counts 2, 4 and 6 come from three 0.25 m² plots. Find density. For a different model with N = 200, K = 400 and r = 0.1, calculate one logistic step and state what changes if K declines. [community-change] A fresh equal-effort synthetic community has counts 8, 4, 4 and 4. Calculate richness and the stated Simpson diversity, then decide whether a one-time lower index near a road proves road runoff caused the difference. [physical-disturbance] A new disturbed plot recovers faster than another despite similar initial cover loss. Does this refute the role of physical disturbance or require identical future communities?
Calibration: [energy-matter-ledgers] NPP is 6000, herbivore transfer 10%, carnivore transfer 15% and combined transfer 1.5%. A non-10% efficiency does not violate conservation; respiration, waste and unconsumed production account for energy not transferred into new consumer biomass. [population-sampling] Twelve plants in 0.75 m² gives 16/m². The logistic step is 200 + 0.1 × 200 × (1 − 200/400) = 210. A lower K reduces the modeled increment and can make it negative; K is a condition-dependent parameter, not a permanent species constant. [community-change] Richness is 4 and diversity is 1 − (0.4² + 3 × 0.2²) = 0.72. A road association does not prove runoff causation; compare sampling effort, habitat, season and replicated exposure/control evidence before making that causal claim. [physical-disturbance] No. Surviving organisms, refugia, seed banks, hydrology and colonization can differ after similar initial loss. Investigate those mechanisms instead of assuming identical recovery or treating one trajectory as a disproof.
Evidence to retain
[energy-matter-ledgers] Science criteria 1–2: approximate transfer and all three material cycles; criterion 5: quantitative evidence with boundaries and uncertainty. [population-sampling] Science criterion 3: growth and density-dependence; criterion 5: sampling/variation and model limits. Field technique is not certified by supplied counts. [community-change] Science criteria 3–5: behavior/population context, interactions and cautious human-impact inference; criterion 2: nutrient mechanism linked to cycles, not a causal claim from association alone. [physical-disturbance] Science criteria 4 and 5: disturbance mechanisms, checked comparisons with correct units, reference limits and a qualified recovery prediction.
Record units, calculations, source/date, uncertainty, and what is measured versus inferred. A simulation or supplied dataset must stay labeled as such. These are public, nonsecure paper/data practice activities, not performed laboratory work. No culture of unknown microbes, human biological samples, medical or genetic personal disclosures, unsafe chemicals, or DNA manipulation instructions are authorized. Use supplied data, approved reference images, or a preapproved non-destructive observation. An instructor must review safety, accessibility and the exact practical contract before any physical activity; a worksheet does not certify hands-on technique.
Return to all eight learning pathways. Print this unit page for the student lessons; the linked five-page packet remains the separate assessment companion.
Use the investigation design before assessment
Each linked design gives materials, controls, sampling, procedure, uncertainty and the required human practical/safety review. No worksheet certifies an unobserved technique.
Unit mastery rubric
| Criterion | Developing | Proficient | Mastery |
|---|---|---|---|
| Energy flow & trophic levels | Treats all transfer as exactly ten percent. | Uses a ratio with incomplete units. | Traces energy flow and uses about 10% transfer as an approximate model, explaining why efficiency varies and energy remains conserved. |
| Nutrient cycles | Uses one generic cycle without reservoirs. | Names some processes with missing pathways. | Traces carbon, nitrogen, and water through their principal reservoirs and processes and reconciles bounded ledgers. |
| Population dynamics | Extrapolates growth without conditions. | Uses a model with partial interpretation. | Models and interprets exponential and logistic growth, carrying capacity, sampling variation and limiting factors using supplied data. |
| Community interactions | Labels interactions without evidence. | Recognizes direct effects with prompting. | Explains predation, competition, symbiosis and environmental responses, including testable indirect effects. |
| Human impact & data interpretation | Treats association or one index as causal proof. | Calculates an index with missing sampling limits. | Interprets diversity, sampling and environmental comparisons with stated conventions, controls, uncertainty and causal limits. |
| Integration (cross-domain) | Makes no supported connection between the source and the science. | Uses the source but needs help connecting evidence, writing, or limitations to the science. | Independently connects History, Reading, and Writing using a cited source, appropriate evidence, a limitation, and a scientific explanation. |
Integration is reported separately and cannot lower the science grade or block a science demonstration pass. Science and practical criteria determine that pass. Use the integration guide's evidence checklist for the separately reported criterion.
NPP = 20000 − 12000 = 8000 kJ/m²/year. Herbivore transfer is 1200/8000 = 15%; carnivore transfer is 180/1200 = 15%; combined transfer is 2.25%, not 30%. Final ledger stocks are 1050 kg C, 43 kg N and 250 mm water, with the specified boundaries.
“I completed the ecology worksheet, so I have mastered every science and practical criterion.” Completion and public answers are not evidence of independent mastery or observed technique.
Agree the level and specific science/practical contract before instruction. Retain an independent first attempt, source interpretation, calculations and a fresh instructor variation or observation. Public worked answers are nonsecure practice, not a private examination.
A 5-page clipboard packet — unit overview, key terms, the mastery rubric, anchor examples, and a score sheet you can print and grade against.