Unit 07 · Natural Selection
Use the natural selection learning pathway for original readings, models, supplied data, checked practice and fresh transfer. The five science criteria stay distinct from integration; a paper/data alternative does not certify an unobserved technique.
Student learning: Natural Selection
Choose the level by readiness, not age alone, and record it before instruction. Foundation, core, and honors tasks are study pathways, not an AP course or a promise of college credit. The instructor retains practical assessment and the published science rubric; integration is reported separately.
Prerequisites: Allele counts, heredity, ratios and branching diagrams. Core uses null genotype expectations; honors uses fitted-frequency df 1 χ² and phylogenetic limitations.
Suggested sequence: read and discuss the explanation; attempt the worked model; analyze the data at your selected level; check the answers; then complete the source-linked response and a fresh transfer question. These activities supplement, not replace, supervised practical work and the full-year schedule.
Assigned reading and focus
- OpenStax Biology 2e (2018), 18.1 Understanding Evolution. [selection-drift] Read evidence and common misconceptions. Evolution describes population change and common ancestry, not individuals trying to change.
- OpenStax Biology 2e (2018), 19.2 Population Genetics. [selection-drift] Compare selection, gene flow and genetic drift; drift is a sampling effect, not a synonym for any change.
- OpenStax Biology 2e (2018), 19.3 Adaptive Evolution. [selection-drift] Compare relative fitness, directional/stabilizing/disruptive selection and artificial selection. Fitness concerns reproductive contribution in context, not physical strength.
- OpenStax Biology 2e (2018), 19.1 Population Evolution. [equilibrium-audit] Read Hardy–Weinberg conditions and allele/genotype frequencies. Separate a null expectation from observed evidence of change.
- NIST/SEMATECH e-Handbook: Critical Values of the Chi-Square Distribution. [equilibrium-audit] Use the supplied upper-tail α = 0.05 threshold 3.841 at df = 1. The genotype example estimates one allele frequency from the sample, reducing df by one.
- OpenStax Biology 2e (2018), 20.2 Determining Evolutionary Relationships. [phylogeny-speciation] Read homologous traits, molecular comparisons and phylogenetic inference; sister tips share an ancestor and are not ancestors of each other.
- OpenStax Biology 2e (2018), 18.1 Understanding Evolution. [phylogeny-speciation] Connect fossil, anatomical and molecular evidence; distinguish homology from convergence.
- OpenStax Biology 2e (2018), 18.2 Formation of New Species. [phylogeny-speciation] Compare allopatric/sympatric pathways and prezygotic/postzygotic barriers.
- OpenStax Biology 2e (2018), 18.3 Reconnection and Speciation Rates. [phylogeny-speciation] Read reinforcement, hybrid zones and limits of simple species models.
- OpenStax Biology 2e (2018), 19.3 Adaptive Evolution. [molecule-fitness] Read relative fitness and selection on heritable variation. Fitness is reproductive contribution in a context, not a universal measure of strength.
- OpenStax Biology 2e (2018), 6.5 Enzymes. [molecule-fitness] Connect protein variation and environmental conditions to measured reaction rate; rate alone does not establish whole-organism fitness.
- OpenStax Biology 2e (2018), 4.3 Eukaryotic Cells. [eukaryote-evidence] Compare nuclear organization, internal compartments, mitochondria and chloroplasts in the reference figures. Use cell type and life stage, not universal organelle assumptions.
- OpenStax Biology 2e (2018), 20.2 Determining Evolutionary Relationships. [eukaryote-evidence] Read homology and molecular comparisons; distinguish an identification matrix from independently supported ancestry evidence.
- OpenStax Biology 2e (2018), 18.3 Reconnection and Speciation Rates. [speciation-tempo] Read reconnection and varying rates. Separate a lineage-splitting rate from the speed of a morphological change or gaps in a fossil record.
- NASA (2025): Asteroid Bennu Sample Reveals Mix of Life’s Ingredients. [origin-evidence] Read the opening finding and the distinction between organic ingredients and evidence of life. Identify the sample-return and contamination-control context.
- NobelPrize.org: Chemistry 1989 press release on catalytic RNA. [origin-evidence] Read the 1989 press-release summary. Explain why RNA catalysis is relevant to an RNA-world hypothesis but is not a complete recreation of the first life.
- USGS: Age of the Earth. [origin-evidence] Read why radiometric ages and meteorites constrain Earth history. Distinguish an age bound from the duration or mechanism of an origin process.
Learn the science
[selection-drift] Natural selection requires variation, a heritable component and differences in reproductive contribution in the relevant environment. Individuals can survive or reproduce differently; populations change in frequencies. Neither mutations nor organisms know which variants a future environment will favor.
[selection-drift] Drift is random sampling of heritable variants and is often stronger in small populations. Founder effects and bottlenecks alter samples without requiring an adaptive benefit. Gene flow moves alleles among populations. Selection, drift and gene flow can operate together; a frequency change alone does not isolate one cause.
[selection-drift] In the simplified haploid model below, each individual has one allele, so genotype and allele frequencies coincide. Counts are expected descendants after the supplied reproduction weights, not repeated independent field measurements. Relative fitness is divided by the largest reproductive weight.
[selection-drift] Artificial selection changes reproductive contribution through human choices; it still acts on existing heritable variation. A large relative fitness here is not a permanent ranking of biological quality. Environmental changes or trade-offs can reverse which trait is favored.
[equilibrium-audit] For a diploid two-allele locus, p + q = 1 and Hardy–Weinberg genotype proportions are p², 2pq and q² under random mating and the idealized absence of selection, migration, mutation and appreciable drift. The model is a null reference, not a claim that every population satisfies its conditions.
[equilibrium-audit] Count alleles directly when genotype counts are known: p = (2NAA + NAa)/(2N). Estimating q from the square root of a recessive phenotype frequency additionally assumes equilibrium genotype proportions, simple dominance and reliable full-penetrance classification; it is not a universally valid shortcut.
[equilibrium-audit] A genotype departure can occur without an allele-frequency change, for example through nonrandom mating or mixing subpopulations. Rejecting Hardy–Weinberg genotype proportions does not identify the mechanism and does not by itself demonstrate temporal allele-frequency change.
[equilibrium-audit] For the supplied independent diploid sample, χ² compares observed counts to fitted p²N, 2pqN and q²N; df = 3 categories − 1 total constraint − 1 estimated p = 1. All expected counts exceed 5. Use a predeclared α = 0.05 and critical 3.841. Real related individuals, structure or genotype error can invalidate simple independent-sampling inference.
[phylogeny-speciation] A phylogeny is a branching hypothesis of relationships, not a ladder of progress. Rotating a branch around a node leaves the relationships unchanged. Tips represent sampled lineages; neither of two sister tips is necessarily the ancestor of the other. Branch length only indicates time or amount of change when a scale says so.
[phylogeny-speciation] Homologous characters are inherited from a common ancestor; similar function alone can arise by convergence. Molecular comparisons require homologous aligned sites. A short sequence distance is evidence, not a complete phylogeny or a molecular clock without calibration and an appropriate model.
[phylogeny-speciation] In the supplied alignment, B and C share a derived base at position 10 relative to the outgroup and A; A, B and C share a derived base at position 6 relative to the outgroup. These characters support the rooted hypothesis (O,(A,(B,C))) in this toy model. The table lacks information for branch dates.
[phylogeny-speciation] Reduced gene flow and diverging heritable traits can lead to reproductive isolation. Geographic separation is a possible cause, not by itself a guarantee of speciation. Prezygotic barriers act before zygote formation; postzygotic barriers act after. The biological species concept has limits for asexual lineages and fossils.
[molecule-fitness] An inherited sequence variant can influence molecular activity and a phenotype relevant to reproduction. Selection operates through differential reproductive contribution; a favorable laboratory enzyme rate alone is not a complete measure of fitness.
[molecule-fitness] These synthetic paired-assay/population records use the same starting number and observation interval. Each offspring column represents an independently founded population under the listed condition, not repeated readings of one culture.
[molecule-fitness] Mean offspring per founder is a model measure of absolute reproductive output; dividing by the larger value within an environment gives relative fitness. Genetic background, expression level and other environmental differences must be controlled before attributing all changes to one allele.
[eukaryote-evidence] Representative animal, plant, fungal and protist cells share nuclear organization and many cellular/molecular systems. These similarities, interpreted with homologous sequences and other evidence, support common eukaryotic ancestry.
[eukaryote-evidence] A green-plant chloroplast is not required in every eukaryotic lineage. Some cells or lineages secondarily reduce or lose conspicuous structures; mature mammalian red blood cells are not a counterexample that overturns ancestry because they lack a nucleus.
[eukaryote-evidence] This selected trait matrix is a reference summary, not a measured probability of ancestry. Living species are tips of a branching history, not a ladder in which one selected modern representative must be the ancestor of another.
[speciation-tempo] Speciation concerns lineage divergence and reproductive isolation. The number of observed branching events needs a denominator reflecting observation opportunity; six events over more lineages/time may not mean a faster underlying rate.
[speciation-tempo] In the supplied simulation, lineage exposure is the sum of time observed across lineages, in lineage-million-years. Divide events by exposure to compare the model groups. Detection, extinction and model definitions limit interpretation; the ratio is not an instantaneous field rate.
[speciation-tempo] Morphological change within a sampled record is not automatically a speciation event. Sparse preservation can hide change during a missing interval. Gradualism and punctuated patterns are hypotheses about tempo and sampling, not instructions to count every trait change as a new species.
[origin-evidence] Evidence relevant to origins addresses different questions: where precursor molecules can occur, whether a molecule can both carry information and catalyze reactions, and which geological times are possible. These are not interchangeable observations.
[origin-evidence] Bennu sample organics are ingredients, not a discovered organism. Catalytic RNA demonstrates an important biochemical possibility but does not establish that a complete self-sustaining RNA-first system arose under one uniquely known early-Earth setting.
[origin-evidence] A selected preserved record establishes life by that time under the dating and biological interpretation assumptions. The interval from Earth formation to that record is not a stopwatch measurement of how long the origin of life took. Older evidence could move a bound without identifying a mechanism.

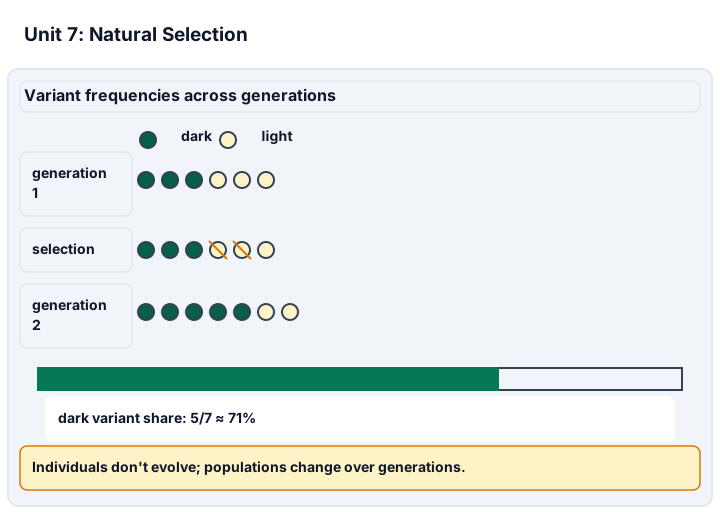
Diagram description
Unit 7: Natural Selection. Variant frequencies across generations: generation 1 3 dark, 3 light; generation 2 5 dark, 2 light.
Data, provenance, and assumptions
| Allele | Initial count | Descendants per parent |
|---|---|---|
| A | 100 | 3 |
| a | 100 | 1 |
| Population draw | A count | a count |
|---|---|---|
| Draw A | 3 | 7 |
| Draw B | 6 | 4 |
| Draw C | 4 | 6 |
| Draw D | 7 | 3 |
| Snapshot | AA | Aa | aa |
|---|---|---|---|
| Earlier | 36 | 48 | 16 |
| Later | 50 | 20 | 30 |
| Lineage | Aligned sequence |
|---|---|
| O | AACCGGTTAACC |
| A | AACCGATTAACC |
| B | AACCGATTAGCC |
| C | AACCGATTAGCT |
| Case | Given evidence |
|---|---|
| Timing | Groups flower in different months despite overlap in habitat |
| Hybrid fertility | Hybrids form but produce no viable gametes |
| Island separation | Separated populations have not been tested for reproductive compatibility |
| Variant and environment | Temperature (C) | Enzyme rate (relative units) | Founders per population | Descendants A | Descendants B | Descendants C |
|---|---|---|---|---|---|---|
| Reference / warm | 35 | 40 | 20 | 20 | 24 | 28 |
| Variant / warm | 35 | 70 | 20 | 32 | 36 | 40 |
| Reference / cool | 20 | 75 | 20 | 40 | 44 | 48 |
| Variant / cool | 20 | 60 | 20 | 30 | 34 | 38 |
| Representative | Nuclear envelope | Mitochondria | Nuclear linear chromosomes | Chloroplasts |
|---|---|---|---|---|
| Animal epithelial cell | Present | Present | Present | Absent |
| Bean leaf mesophyll cell | Present | Present | Present | Present |
| Budding yeast cell | Present | Present | Present | Absent |
| Paramecium cell | Present | Present | Present | Absent |
| Model group | Branching events | Exposure (lineage-million-years) |
|---|---|---|
| Isolated | 6 | 20 |
| Connected | 3 | 30 |
| Elapsed time (Myr) | Supplied taxon code | Mean trait length (mm) |
|---|---|---|
| 0 | 1 | 10 |
| 1 | 1 | 10.2 |
| 4 | 1 | 12 |
| 5 | 1 | 12.1 |
| Source record | What it supports | What it does not establish |
|---|---|---|
| NASA Bennu sample organics, 2025 | Prebiotic ingredients can occur in extraterrestrial material | Life on Bennu or a complete origin pathway |
| Catalytic RNA research, Nobel Chemistry 1989 | RNA can perform catalytic functions as well as information-related roles | The identity or full chemistry of the first organism |
| USGS radiometric Earth-age explanation | An approximately 4.54 Ga Earth-age constraint | A directly measured duration of the origin of life |
| Reference | Age before present (Ga) |
|---|---|
| Earth formation | 4.54 |
| Preserved microbial evidence | 3.5 |
Worked model
[selection-drift] Expected selected descendants are 300 A and 100 a, giving p(A) = 0.75 versus initial 0.5. Relative fitness is 1 for A and 1/3 for a under this condition. Drift-only draws have p(A) values 0.3, 0.6, 0.4 and 0.7; no one direction is guaranteed. [equilibrium-audit] Earlier p = (72 + 48)/200 = 0.6; later p = (100 + 20)/200 = 0.6 too. For the later sample, fitted expected counts are 36, 48, 16. χ² = 196/36 + 784/48 + 196/16 = 34.027778, above 3.841 at df 1: reject this genotype-proportion null under the stated assumptions. The measured allele-frequency change remains 0, not evidence of a temporal change in p. [phylogeny-speciation] B and C differ at 1 of 12 sites, giving raw mismatch proportion 0.083333. In this actual alignment, all ingroup lineages share the base at position 6 and B/C share the base at position 10; inspect the columns rather than memorizing site numbers. Timing is prezygotic, hybrid infertility postzygotic, and island separation alone leaves compatibility unknown. [molecule-fitness] Warm reference populations average 24 descendants, or 1.2 per founder. The warm variant averages 36, or 1.8 per founder; relative reference fitness is 24/36 = 0.666667. In cool conditions reference averages 44 and variant 34; the variant relative value is 34/44 = 0.772727. The favored variant reverses with environment. [eukaryote-evidence] All four selected examples share the first three features, while only the bean leaf example has chloroplasts. Counting four matching rows is a description of this selection, not a four-trial probability test of common ancestry. [speciation-tempo] The model event rates are 6/20 = 0.30 and 3/30 = 0.10 per lineage-million-year, a ratio of 3. Trait slopes are 0.2, 0.6 and 0.1 mm/Myr; the largest interval slope does not identify when within the three-million-year sampling gap the change occurred. [origin-evidence] The supplied chronology spans 4.54 - 3.50 = 1.04 billion years from formation to the assumed preserved record. That subtraction does not give a measured origin duration. The evidence cards support constraints and plausible components, not a complete historical reconstruction.
Numerical calibration
- 0.75 A frequency among expected descendants
- 0.25 allele-frequency change, not percent relative change
- 0 later minus earlier p(A)
- 34.027778 χ² with df = 1, estimated p
- 3.841 upper-tail α = 0.05 critical value, NIST df = 1
- 0.083333 raw mismatch proportion, B versus C
- 1.2 mean descendants per founder
- 1.8 mean descendants per founder
- 0.666667 within warm environment
- 0.772727 within cool environment
- 4 selected reference examples
- 1 selected chloroplast-bearing example
- 0.3 events per lineage-million-year
- 0.1 events per lineage-million-year
- 3 isolated/connected model rate
- 0.6 mm/Myr, interval average
- 0.2 events per lineage-million-year
- 1.04 Ga between the supplied anchors
- 0.84 Ga in the changed-evidence scenario
Attempt the assigned level
Try the tasks before reading the calibration. These are practice answers, not a secure examination; use a new dataset or changed assumption for the assessed transfer.
Foundation: typically grades 7-8
- [selection-drift] Calculate each allele’s expected descendants in haploid-selection and the four drift-replicates frequencies. Explain why a small population can change without a variant being “better.” Evidence: science criteria 1, 5; AP-connection objectives 7.1.A, 7.1.B, 7.2.A, 7.4.A, 7.4.B (selected task connection, not full objective mastery).
- [equilibrium-audit] Count A and a alleles in each genotype-snapshots row and calculate p and q. Do the changed genotype counts necessarily mean that the allele frequency changed? Evidence: science criteria 3, 5; AP-connection objectives 7.5.A (selected task connection, not full objective mastery).
- [phylogeny-speciation] Count differences between B and C in phylogeny-sequences and classify the timing and hybrid-fertility cases. Explain why C is not automatically “more evolved” because it has one extra difference. Evidence: science criteria 2, 4, 5; AP-connection objectives 7.6.A, 7.9.A, 7.10.A (selected task connection, not full objective mastery).
- [molecule-fitness] Compare enzyme rate and descendant counts for the two variants in each environment. Identify whether one variant is favored in both settings. Evidence: science criteria 1, 2; AP-connection objectives 7.2.B (selected task connection, not full objective mastery).
- [eukaryote-evidence] Count the examples sharing the first three features and identify which has chloroplasts. State one reason the table is not a list of evolutionary stages. Evidence: science criteria 2, 5; AP-connection objectives 7.7.A (selected task connection, not full objective mastery).
- [speciation-tempo] Compare event counts and their exposure denominators. Describe what changes in the trait series and what remains unknown between observations. Evidence: science criteria 4, 5; AP-connection objectives 7.10.B (selected task connection, not full objective mastery).
- [origin-evidence] Match each source card with the question it can address. Explain why an amino acid detected in an asteroid sample is not the same finding as an organism. Evidence: science criteria 2, 5; AP-connection objectives 7.12.A (selected task connection, not full objective mastery).
Check after your attempt
- [selection-drift] Expected counts are 300 A and 100 a, so A becomes 0.75. Drift frequencies are 0.3, 0.6, 0.4 and 0.7. Sampling can overrepresent or lose variants without a fitness difference; individuals did not choose mutations to meet a need.
- [equilibrium-audit] Both samples have 120 A and 80 a alleles, giving p = 0.6 and q = 0.4. The genotype counts differ, but measured allele frequencies are unchanged; genotype proportions and allele frequencies are distinct quantities.
- [phylogeny-speciation] B and C differ at one of 12 sites. Different flowering times are a prezygotic barrier; sterile hybrids are a postzygotic barrier. C is not a more-advanced stage; living tips are lineages with histories, not rungs on a progress ladder.
- [molecule-fitness] The variant has higher supplied rate and descendant counts in warmth, while the reference has higher values in the cool setting. No one variant is superior in both environments; these are constructed comparisons.
- [eukaryote-evidence] Four selected examples share the first three features; one has chloroplasts. The examples are living representative cell types, not ordered ancestors or steps toward a superior organism.
- [speciation-tempo] The isolated model has six events over 20 lineage-million-years and the connected model three over 30. Trait length increases, but observations do not show exactly what happened between the dated samples.
- [origin-evidence] NASA addresses precursor ingredients, RNA research addresses catalytic capability, and geological dating constrains time. A precursor molecule does not by itself show reproduction, metabolism, cellular organization or life in the sampled material.
High-school core: typically grades 9-10
- [selection-drift] Compute initial and descendant frequencies plus relative fitness. Contrast this prespecified selection mechanism with drift and with a breeder choosing which model individuals reproduce. Evidence: science criteria 1, 2, 5; AP-connection objectives 7.1.B, 7.2.A, 7.3.A, 7.4.C (selected task connection, not full objective mastery).
- [equilibrium-audit] Use p = 0.6 to calculate Hardy–Weinberg expected counts for 100 organisms, compare both snapshots and state the equilibrium conditions before interpreting a departure. Evidence: science criteria 1, 3, 5; AP-connection objectives 7.4.C, 7.5.A (selected task connection, not full objective mastery).
- [phylogeny-speciation] Use the outgroup to identify shared derived sequence states and sketch (O,(A,(B,C))). Rotate the B/C branch, state what stays unchanged and contrast island separation with demonstrated reproductive isolation. Evidence: science criteria 2, 4, 5; AP-connection objectives 7.6.B, 7.9.A, 7.9.B, 7.10.A, 7.10.C (selected task connection, not full objective mastery).
- [molecule-fitness] Calculate mean descendants per founder and normalize within each environment. Explain how the molecular and reproductive records are related but different measurements. Evidence: science criteria 1, 2; AP-connection objectives 7.2.B (selected task connection, not full objective mastery).
- [eukaryote-evidence] Explain why the absence of chloroplasts from three examples does not contradict shared eukaryotic ancestry. Name independent evidence that could support the ancestry interpretation. Evidence: science criteria 2, 5; AP-connection objectives 7.7.A (selected task connection, not full objective mastery).
- [speciation-tempo] Calculate both event rates, their ratio and the interval trait slopes. Explain why a trait slope is not itself a speciation rate. Evidence: science criteria 4, 5; AP-connection objectives 7.10.B (selected task connection, not full objective mastery).
- [origin-evidence] Calculate the interval between the supplied ages and state precisely why it is not the time life took to originate. Keep the assumed microbial date distinct from the source’s Earth-age estimate. Evidence: science criteria 2, 5; AP-connection objectives 7.12.A (selected task connection, not full objective mastery).
Check after your attempt
- [selection-drift] p(A) changes from 0.5 to 0.75, an absolute change of 0.25; relative reproductive weights are 1 and 1/3. Drift samples without a specified fitness difference. A breeder choosing heritable traits imposes artificial selection, not need-directed creation of useful alleles.
- [equilibrium-audit] Expected counts are 36 AA, 48 Aa and 16 aa. The earlier row matches; the later does not. Random mating, reliable sampling and the ideal conditions of no selection, migration, mutation or drift define the null. Nonrandom mating or population mixture can alter genotype proportions without changing p.
- [phylogeny-speciation] The ingroup shares A at position 6 and B/C share G at position 10 relative to the stated outgroup pattern. B/C remain sisters after rotation; neither tip is the ancestor of the other. Island separation can reduce gene flow but does not by itself establish reproductive incompatibility.
- [molecule-fitness] Warm outputs are 1.2 and 1.8; cool outputs are 2.2 and 1.7 per founder. The lower relative values are about 0.667 and 0.773. Enzyme activity may contribute to output but is not itself a count of inherited reproductive contribution.
- [eukaryote-evidence] Chloroplast presence is not universal among eukaryotes and relates to particular lineage histories. Homologous cellular genes and multi-gene phylogenies provide independent evidence; a single absent organelle cannot settle the whole history.
- [speciation-tempo] Rates are 0.30 and 0.10, ratio 3; slopes are 0.2, 0.6 and 0.1 mm/Myr. Length change is not a count of reproductive lineage splits, so the units and biological interpretation differ.
- [origin-evidence] The scenario interval is 1.04 Ga. It is not an origin duration: preserved evidence shows life by the assumed date, not its first appearance, and formation does not identify when or where a particular prebiotic process began.
Honors extension: typically grades 11-12
- [selection-drift] Predict whether the selected allele must continue increasing if reproductive weights reverse, and explain how genetic diversity could matter under changing conditions without claiming diversity guarantees survival. Evidence: science criteria 1, 2, 5; AP-connection objectives 7.1.B, 7.8.A, 7.11.A, 8.7.A (selected task connection, not full objective mastery).
- [equilibrium-audit] Calculate the later sample’s χ², justify df = 1 rather than 2, and interpret it against 3.841. Explain why the conclusion is not proof of natural selection or temporal allele-frequency evolution. Evidence: science criteria 1, 3, 5; AP-connection objectives 7.5.A (selected task connection, not full objective mastery).
- [phylogeny-speciation] Explain what additional evidence could challenge this one-locus tree and why a raw mismatch proportion is not a branch date. State a limitation of using reproductive compatibility to classify asexual or fossil lineages. Evidence: science criteria 2, 4, 5; AP-connection objectives 7.6.B, 7.9.B, 7.10.C (selected task connection, not full objective mastery).
- [molecule-fitness] Specify controls and additional evidence needed to attribute the reproductive pattern to the molecular variant rather than correlated differences. Evidence: science criteria 1, 2; AP-connection objectives 7.2.B (selected task connection, not full objective mastery).
- [eukaryote-evidence] Evaluate a proposed disproof based on one specialized anucleate cell or an organelle-reduced lineage. Identify the comparison level and missing historical evidence. Evidence: science criteria 2, 5; AP-connection objectives 7.7.A (selected task connection, not full objective mastery).
- [speciation-tempo] Critique a claim of an instantaneous speciation burst at elapsed time 4 Myr, using the model record and at least two potential sampling limitations. Evidence: science criteria 4, 5; AP-connection objectives 7.10.B (selected task connection, not full objective mastery).
- [origin-evidence] Compare an RNA-world hypothesis with ingredient-delivery evidence and explain what additional evidence would be needed to evaluate a complete origin pathway. Evidence: science criteria 2, 5; AP-connection objectives 7.12.A (selected task connection, not full objective mastery).
Check after your attempt
- [selection-drift] Reversed weights can favor a instead, so the earlier advantage is environment-dependent. Heritable diversity can supply variants with different responses to new pressures, but small-population losses, chance and severe pressures can still cause extinction. Multiple mechanisms and real reproductive data would be needed to explain a field trend.
- [equilibrium-audit] χ² is about 34.027778. One allele frequency was estimated, so df = 3 − 1 − 1 = 1. Reject the specified genotype-proportion null at α 0.05, but this does not identify selection. The two measured p values are both 0.6; structure, mating pattern or error are alternatives.
- [phylogeny-speciation] Independent homologous loci, morphology and fossil context can reveal conflicting histories, convergence or incomplete lineage sorting. Raw mismatch ignores multiple changes and lacks a calibrated rate, so it is not a date. Compatibility cannot be directly tested for fossils and is not defined the same way for asexual lineages.
- [molecule-fitness] Check genetic background, expression level, starting density, resources, temperature and sampling uncertainty; use independently controlled comparisons. These synthetic associations do not isolate a molecular cause by themselves.
- [eukaryote-evidence] Secondary loss, reduction and cell specialization can remove a visible feature while ancestry is retained. Compare life cycles, homologous genes and developmental context rather than demanding every cell preserve every ancestral structure.
- [speciation-tempo] The sampling gap from 1 to 4 Myr limits temporal resolution. Preservation, detection and uncertain taxon assignment can also bias patterns. A large mean trait slope does not establish a discrete speciation burst at the later sample.
- [origin-evidence] RNA catalysis and extraterrestrial ingredients can be compatible lines of evidence, not competing complete demonstrations. Neither identifies the first organism or supplies a complete pathway through replication, compartmentalization, metabolism and sustained evolution.
History, reading, and writing connection
Use OpenStax’s historical Darwin/Wallace discussion alongside modern selection and phylogeny evidence. Explain how multiple lines of evidence constrain an account of change; distinguish the history of an idea from the new synthetic sequence/count models and avoid need-directed explanations.
Write in your own words or use an approved accessible equivalent. Cite a specific assigned section or figure, identify its evidence, and state one limitation or counterargument. Use the AI practice contract only for permitted coaching, never to invent observations or write the assessed response.
Transfer to a new case
[selection-drift] A fresh synthetic haploid population starts at A = 60 and a = 40; both produce two descendants per parent. What is expected p(A) afterward? Would an actual sample of ten descendants necessarily match it? [equilibrium-audit] A fresh synthetic sample has AA = 25, Aa = 50 and aa = 25. Calculate p, q and expected equilibrium proportions. Does matching this model prove that no selection or migration occurred in its history? [phylogeny-speciation] A fresh synthetic rooted tree is (O,((D,E),F)). If D and E swap left/right positions, has their relationship changed? Would a 2/20 sequence mismatch independently date their split or show that F is their ancestor? [molecule-fitness] A new environment gives both variants the same enzyme assay rate but different reproductive output. Must the reproductive result be rejected because the enzyme rates match? [eukaryote-evidence] A diagram places a modern protist next to a modern mammal. Does the arrangement establish that this protist species was the mammal lineage’s direct ancestor? [speciation-tempo] Another model records four branching events over 20 lineage-million-years and one rapidly changing trait. Calculate the normalized event rate and state whether the trait change proves an extra speciation event. [origin-evidence] Suppose a newly well-supported biological record is dated at 3.7 Ga while the supplied Earth-age anchor stays 4.54 Ga. What interval results, and how does the biological bound change?
Calibration: [selection-drift] Expected counts are 120 and 80, so p(A) remains 0.6. A finite random sample need not match exactly; sampling variation can change the realized frequency without selection. Expectations are not guaranteed small-population outcomes. [equilibrium-audit] p = q = 0.5; expected proportions are 0.25, 0.50 and 0.25, matching the counts. A match does not prove absence of every evolutionary process; different histories can yield these proportions, and one snapshot is not a temporal allele-frequency series. [phylogeny-speciation] D and E remain sisters after rotation. A mismatch of 0.1 is only a raw comparison at the supplied sites; without rate calibration and an evolutionary model it does not date a split. F is another tip, not automatically their ancestor. [molecule-fitness] No. Other traits, expression timing and environmental interactions can influence reproduction. Reassess the proposed mechanism and controls rather than forcing whole-organism fitness to equal one isolated assay. [eukaryote-evidence] No. Neither position in a diagram nor simpler appearance identifies a direct ancestor. Use a branching phylogeny and evidence; modern representatives are not automatically ancestors of one another. [speciation-tempo] The rate is 0.20 events per lineage-million-year. A rapid trait change does not prove speciation; independent lineage or reproductive-isolation evidence is needed before adding another event. [origin-evidence] The interval becomes 0.84 Ga. Under the dating and biological interpretation assumptions, life was already present by 3.7 Ga; this is a latest-by constraint for its presence, not a direct origin time or proof of a mechanism.
Evidence to retain
[selection-drift] Science criteria 1 and 5: heritable variation/reproduction without teleology; criterion 2: quantitative evidence and alternative mechanisms rather than a progress ladder. [equilibrium-audit] Science criterion 3: equilibrium calculation with assumptions; criteria 1 and 5: no selection-as-proof or genotype-departure shortcut; criterion 2: evidentiary limits. [phylogeny-speciation] Science criteria 2 and 4: molecular evidence, branching tree and isolation logic; criterion 5: explicit correction of progress/ancestor misconceptions. [molecule-fitness] Science criteria 1 and 2: connect heritable molecular variation with conditional reproductive outcomes using computed comparisons, controls and transfer. [eukaryote-evidence] Science criteria 2 and 5: source-based shared-feature reasoning, an explicit exception analysis, and a branching-history transfer argument. [speciation-tempo] Science criteria 4 and 5: normalized rate comparison, trait graph, distinction between morphology and lineage splitting, and a source-linked sampling critique. [origin-evidence] Science criteria 2 and 5: evidence classification, conditional chronology, comparison of hypotheses and a defensible statement of what remains unknown.
Record units, calculations, source/date, uncertainty, and what is measured versus inferred. A simulation or supplied dataset must stay labeled as such. These are public, nonsecure paper/data practice activities, not performed laboratory work. No culture of unknown microbes, human biological samples, medical or genetic personal disclosures, unsafe chemicals, or DNA manipulation instructions are authorized. Use supplied data, approved reference images, or a preapproved non-destructive observation. An instructor must review safety, accessibility and the exact practical contract before any physical activity; a worksheet does not certify hands-on technique.
Return to all eight learning pathways. Print this unit page for the student lessons; the linked five-page packet remains the separate assessment companion.
Use the investigation design before assessment
Each linked design gives materials, controls, sampling, procedure, uncertainty and the required human practical/safety review. No worksheet certifies an unobserved technique.
- Selection, random drift and measured generational change
- Hardy–Weinberg expectations and genotype departures
- Sequence evidence, branching ancestry and reproductive barriers
- From enzyme variation to environment-dependent reproductive output
- Shared eukaryotic features and the limits of a trait table
- Normalize speciation opportunities and distinguish trait tempo
- Compare origin-of-life evidence without turning ingredients into organisms
Unit mastery rubric
| Criterion | Developing | Proficient | Mastery |
|---|---|---|---|
| Mechanism of natural selection | Claims organisms change because they need to. | Names selection without heritable/reproductive evidence. | Explains heritable variation, environment-specific fitness and differential reproduction; separates drift and gene flow. |
| Evidence for evolution | Treats one similarity as proof of every relationship. | Names evidence without a supported comparison. | Evaluates fossil, cellular and molecular evidence; distinguishes common-ancestry support from origin hypotheses and dating bounds. |
| Hardy–Weinberg reasoning | Treats a genotype departure as automatic allele change. | Calculates frequencies with missing assumptions. | Calculates frequencies under stated assumptions; distinguishes a departure in genotype proportions from allele-frequency change across generations. |
| Speciation & phylogeny | Reads trees as a ladder or assumes a tip is an ancestor. | Recognizes branches with incomplete barrier reasoning. | Interprets branches, barriers and exposure-normalized rates; distinguishes trait tempo from speciation with sampling limits. |
| Common misconception correction | Uses need, progress or proof language uncritically. | Identifies a misconception with help. | Corrects teleological and null-model misconceptions using the actual counts, conditions and branching evidence. |
| Integration (cross-domain) | Makes no supported connection between the source and the science. | Uses the source but needs help connecting evidence, writing, or limitations to the science. | Independently connects History, Reading, and Writing using a cited source, appropriate evidence, a limitation, and a scientific explanation. |
Integration is reported separately and cannot lower the science grade or block a science demonstration pass. Science and practical criteria determine that pass. Use the integration guide's evidence checklist for the separately reported criterion.
Expected selected descendants are 300 A and 100 a, giving p(A) = 0.75 versus initial 0.5. Relative fitness is 1 for A and 1/3 for a under this condition. Drift-only draws have p(A) values 0.3, 0.6, 0.4 and 0.7; no one direction is guaranteed.
“I completed the natural selection worksheet, so I have mastered every science and practical criterion.” Completion and public answers are not evidence of independent mastery or observed technique.
Agree the level and specific science/practical contract before instruction. Retain an independent first attempt, source interpretation, calculations and a fresh instructor variation or observation. Public worked answers are nonsecure practice, not a private examination.
A 5-page clipboard packet — unit overview, key terms, the mastery rubric, anchor examples, and a score sheet you can print and grade against.