Unit 08 · Plants, Ecosystems & People
The year closes by placing plants back in the world they feed. This unit covers plants as the primary producers at the base of nearly every food web, primary productivity and the flow of energy through an ecosystem, the roles plants play in the nutrient, carbon, and water cycles, and the human side — agriculture, crops, and food security, plus conservation and biodiversity. Mastery means you can trace energy and matter from sunlight through a plant into an ecosystem, and reason about what happens when people change that flow.
Student learning: Evaluate productivity, crop resources, and resilient plant systems
Choose the level by readiness, not age alone, and record it before instruction. Foundation, core, and honors tasks are study pathways, not an AP course or a promise of college credit. The instructor retains practical assessment and the published science rubric; integration is reported separately.
Prerequisites: Carbon fixation, nutrient cycles, sampling, rates, and comparisons with consistent area and time units.
Suggested sequence: read and discuss the explanation; attempt the worked model; analyze the data at your selected level; check the answers; then complete the source-linked response and a fresh transfer question. These activities supplement, not replace, supervised practical work and the full-year schedule.
Assigned reading and focus
- OpenStax Biology 2e, 46.2: Energy Flow through Ecosystems. Read Productivity within Trophic Levels. Distinguish standing biomass from a production rate and gross from net primary production.
- OpenStax Biology 2e, 31.3: Nutritional Adaptations of Plants. Revisit microbial nutrient acquisition and connect it to carbon supply, residue decomposition, and the limits of a universal agricultural claim.
- OpenStax Biology 2e, 30.6: Plant Sensory Systems and Responses. Read plant defenses. Distinguish a possible stress response from diagnosis of a particular pathogen or a recommendation to apply a treatment.
Learn the science
Plants supply fixed organic carbon to many food webs; decomposers and other microbes recycle nutrients. Most plant dry-mass carbon originates from CO2, while water and mineral uptake remain essential. Early seedling growth can also use stored seed reserves.
Standing biomass is a stock measured at a time. Productivity is a rate. With matching carbon units and periods, net primary production NPP = gross primary production GPP minus plant respiration. A one-time quadrat count does not by itself measure productivity.
Breeding, crop diversity, soil conditions, microbial partners, and management can affect resource use and resilience. Genetic uniformity may increase shared susceptibility, but diversity is not an automatic guarantee of higher yield in every setting.
A chlorotic or damaged leaf has several possible explanations, including nutrients, water, temperature, herbivory, or a pathogen. Consider evidence and prevention through suitable plants and normal care; do not diagnose or apply pesticides from one symptom or an AI answer.
Compare the same area, season, and resource boundary. The table reports supplemental irrigation only, not all water in a product's life cycle. This is a constrained classroom comparison, not a universal recommendation for farming.

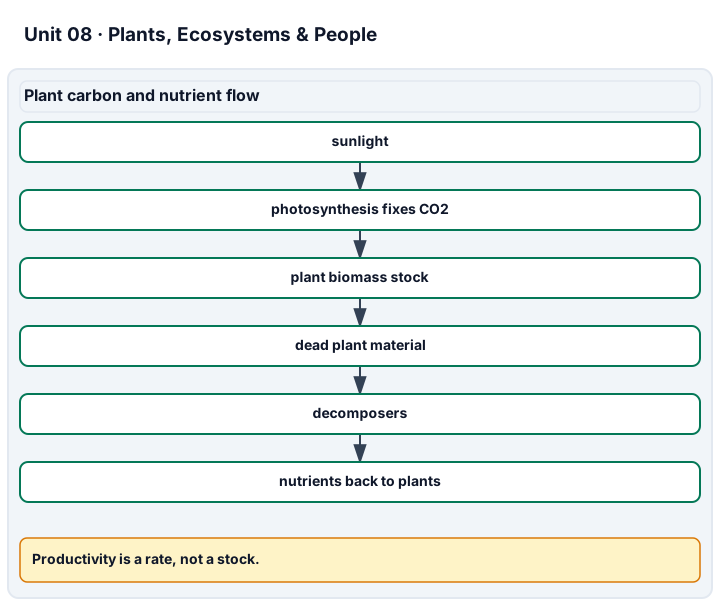
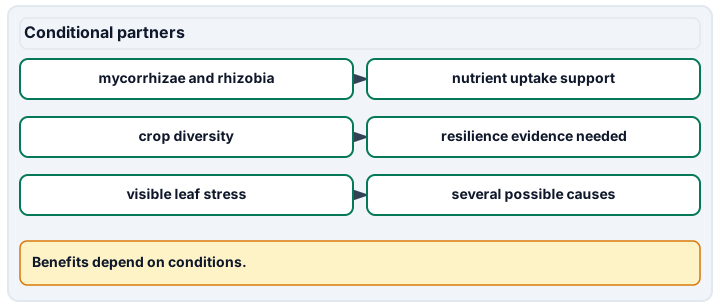
Diagram description
Sunlight supports photosynthesis, photosynthesis fixes carbon dioxide into plant biomass, biomass can become dead plant material, decomposers recycle nutrients back to plants, and productivity is computed as a rate. Microbial partners can support nutrient uptake, but benefits and resilience claims require evidence.
Data, provenance, and assumptions
| System | Harvest dry yield (tonnes/ha) | Supplemental irrigation (m^3/ha) | Applied nitrogen (kg/ha) |
|---|---|---|---|
| A | 6 | 1200 | 100 |
| B | 5.5 | 800 | 60 |
| GPP (g C/m^2/day) | Plant respiration (g C/m^2/day) |
|---|---|
| 20 | 8 |
Worked model
System A uses 1200/6 = 200 m^3 of supplemental irrigation per harvested tonne; B uses 800/5.5, about 145.45 m^3/tonne. The carbon model gives NPP = 20-8 = 12 g C/m^2/day. Resource intensity, yield per area, and carbon production are different measurements.
Numerical calibration
- 200 m^3/tonne
- 145.45 m^3/tonne
- 12 g C/m^2/day
Attempt the assigned level
Try the tasks before reading the calibration. These are practice answers, not a secure examination; use a new dataset or changed assumption for the assessed transfer.
Foundation
- Compare yield and supplemental irrigation per hectare, naming a trade-off.
- Calculate NPP and explain why it needs a time unit.
Check after your attempt
- A has higher yield per hectare but uses more supplemental irrigation and nitrogen in this table.
- NPP is 12 g C/m^2/day; it is a rate, not a standing stock.
High-school core: typically grades 9-10
- Calculate irrigation per tonne for both systems.
- For 10 hectares, find total harvest and irrigation and identify which system meets a minimum 55-tonne harvest with at most 9,000 m^3 irrigation.
Check after your attempt
- A: 200 m^3/tonne; B: about 145.45 m^3/tonne.
- A: 60 tonnes and 12,000 m^3; B: 55 tonnes and 8,000 m^3. Only B meets both stated constraints in this synthetic example.
Honors extension: typically grades 11-12
- Compare the percentage reduction in irrigation per hectare with the reduction per tonne.
- Propose replicated measurements needed before recommending a real system, including soil, climate, crop genetics, and disease/stress context.
Check after your attempt
- Per hectare the reduction is about 33.33%; per tonne it is about 27.27%. The different denominators answer different questions.
- Use independent field replicates across relevant conditions, consistent resource boundaries, and evidence of yield, costs, and ecological effects; the two-row exercise alone is insufficient.
History, reading, and writing connection
Use the assigned ecology and nutrition sources to evaluate a food-security or conservation claim. Defend a decision under explicit constraints, include a counterargument, and distinguish synthetic calculations from field evidence.
Write in your own words or use an approved accessible equivalent. Cite a specific assigned section or figure, identify its evidence, and state one limitation or counterargument. Use the AI practice contract only for permitted coaching, never to invent observations or write the assessed response.
Transfer to a new case
A third field has more plants in a quadrat on one day. Does that establish greater annual productivity?
Calibration: No. Counts, plant sizes, growth over time, losses, and the sampled area must be considered. One standing observation is not a production rate.
Evidence to retain
Submit the normalized resource calculations, carbon budget, conditional decision, and an evidence-based follow-up design. No pest, pathogen, fertilizer, or pesticide experiment is required.
Record units, calculations, source/date, uncertainty, and what is measured versus inferred. A simulation or supplied dataset must stay labeled as such. Use the approved normal-care observation plan or supplied data. Do not culture unknown microbes, inoculate plants, apply hormones or pesticides, or eat study specimens.
Return to all eight learning pathways. Print this unit page for the student lessons; the linked five-page packet remains the separate assessment companion.
Unit mastery rubric
| Criterion | Developing | Proficient | Mastery |
|---|---|---|---|
| Plants as primary producers | Cannot explain where a food web’s energy begins. | Names producers but not their role at the base of the web. | Explains how plants convert sunlight into the chemical energy that feeds nearly every food web, and places producers at the base. |
| Primary productivity & energy flow | Confuses biomass, production, and energy flow. | Uses a rate without matching area, time, or respiration terms. | Distinguishes standing biomass from productivity, calculates assigned GPP/NPP quantities, and explains energy transfer with appropriate limits. |
| Plants in nutrient, carbon & water cycles | Cannot connect plants to any biogeochemical cycle. | Names a cycle but not the plant’s role in it. | Explains how plants move carbon, nutrients, and water through their cycles — from photosynthesis to transpiration to decomposition. |
| Agriculture, food security & conservation | Assumes one crop system is always best. | Names a trade-off but mixes resource boundaries or ignores conditions. | Compares yield, resources, diversity, and stress/defense context under stated constraints, without turning a small dataset into a universal recommendation. |
| Lab technique (field survey & productivity estimate) | Cannot define the sampling unit or time interval. | Collects a snapshot but calls it a production rate. | Runs an approved survey or monitored-production task with sample units, area, and time stated; distinguishes counts and stocks from rates. |
| Integration (cross-domain) | Makes no supported connection between the source and the science. | Uses the source but needs help connecting evidence, writing, or limitations to the science. | Independently connects History, Reading, and Writing using a cited source, appropriate evidence, a limitation, and a scientific explanation. |
Integration is reported separately and cannot lower the science grade or block a science demonstration pass. Science and practical criteria determine that pass. Use the integration guide's evidence checklist for the separately reported criterion.
“Plants supply fixed carbon to this food web. My one-day quadrat count estimates abundance, not productivity; a production estimate needs a time interval and an appropriate method. I compare irrigation per hectare and per tonne separately and keep a recommendation within the supplied conditions.”
“Plants are food for animals. Energy just goes around the ecosystem. I counted some plants but I’m not sure what the number tells me.”
You demonstrate this unit through a field survey and a productivity estimate — sampling seed dispersal or fruit set and reasoning from your data aloud, not a multiple-choice test. A criterion counts as mastered only when you can both run the survey and justify the plant biology behind it. Mastery is demonstrated, not awarded.
A 5-page clipboard packet — unit overview, key terms, the mastery rubric, anchor examples, and a score sheet you can print and grade against.