Unit 01 · Ecosystems & Energy Flow
Trace energy rather than memorize one percentage. Read food webs, calculate GPP/NPP and transfer, and defend a quadrat or transect design without treating a supplied table as an observed field survey.
Student learning: Energy budgets, food webs, and defensible sampling
Choose the level by readiness, not age alone, and record it before instruction. Foundation, core, and honors tasks are study pathways, not an AP course or a promise of college credit. The instructor retains practical assessment and the published science rubric; integration is reported separately.
Prerequisites: Ratios, area, graph axes, and the difference between a stock and an amount produced per year.
Suggested sequence: read and discuss the explanation; attempt the worked model; analyze the data at your selected level; check the answers; then complete the source-linked response and a fresh transfer question. These activities supplement, not replace, supervised practical work and the full-year schedule.
Assigned reading and focus
- OpenStax Biology 2e, 46.2: Energy Flow through Ecosystems. Read How Organisms Acquire Energy in a Food Web, Productivity within Trophic Levels, and the ecological-pyramid discussion. Annotate the distinction between standing biomass and production per area per time.
- OpenStax Biology 2e, 45.1: Population Demography. Read Population Size and Density and Population Research Methods, especially the quadrat example. Explain why a convenient roadside plot need not represent the whole habitat.
- NOAA: What Are El Niño and La Niña?. Read the El Niño paragraph about upwelling, nutrients, phytoplankton, and fish. Trace a physical driver through a food web; do not assume that every species responds identically.
- OpenStax Biology 2e: 44.3 Terrestrial Biomes. [biome-comparison] Water balance is not a biome label: Compare all eight named terrestrial biomes, especially precipitation seasonality, winter temperature and dominant vegetation rather than memorizing one annual rainfall boundary.
- OpenStax Biology 2e: 44.4 Aquatic Biomes. [biome-comparison] Water balance is not a biome label: Compare lakes, rivers, estuaries, coral reefs and ocean zones. Identify salinity, depth/light, flow and substrate as different constraints.
- OpenStax Biology 2e: 45.6 Community Ecology. [ecological-interactions] Interactions need controls, not just plus/minus labels: Read predation/herbivory, competition, mutualism, commensalism and parasitism. Ask what response of each partner would establish the sign of an interaction.
Learn the science
A food-web arrow points from a resource to its consumer. Producers fix inorganic carbon using light or chemical energy; consumers obtain organic matter by feeding. Decomposers also respire and release heat. Matter cycles, but usable energy needs a continuing input and does not cycle back from heat to producers.
Gross primary productivity (GPP) is the rate of energy fixation. Net primary productivity (NPP) equals GPP minus autotrophic respiration, not minus all ecosystem respiration. Keep the same area, time interval, and energy units on both terms. A biomass snapshot in grams cannot be subtracted from an annual energy flow in kilojoules.
Trophic transfer efficiency equals production at the receiving level divided by production at the supplying level. The 10% rule is a teaching approximation, not a universal constant. Uneaten tissue, waste, and respiration affect transfer. Standing biomass can sometimes be inverted even when an energy-production pyramid cannot.
Temperature, precipitation, light, salinity, and nutrients help constrain biomes. A niche describes resource use and interactions, not just an address. A keystone effect is disproportionate to abundance: propose a mechanism for a removal effect, then seek evidence rather than declaring that every food web must respond in one way.
A quadrat estimates density over a known area; a transect samples change along a stated line. Random or stratified placement can reduce selection bias. Repeated measurements within one plot are not independent plots. The two recognizable plant types below are a classroom grouping, not a complete taxonomic inventory.
[biome-comparison] Water balance is not a biome label: A biome is a broad climate–vegetation association, not a species list or a latitude alone. Annual precipitation (P) divided by potential evapotranspiration (PET, atmospheric water demand when water is available) is a screening ratio, not actual evapotranspiration. Tundra can have P/PET above one yet a short growing season and frozen soil. Savanna and grassland both support grasses, but frost and wet/dry timing differ. In aquatic habitats, salinity tolerance, mixing, light penetration and nutrients can outweigh rainfall at the shore; deep ocean water is not illuminated simply because the surface is.
[biome-comparison] Water balance is not a biome label: Model and provenance assumptions: The eight climate profiles are synthetic representative contrasts over one modeled year, not classification thresholds or measured biome averages. PET shares the mm/year denominator with P. Aquatic depths and salinities describe illustrative habitats, not entire ecosystems.
[biome-comparison] Water balance is not a biome label: Uncertainty and inference limits: Annual totals conceal seasonal drought, extremes, fire and soil effects. Dry-month counts alone do not describe timing. A coral reef and open ocean can share salinity but differ in light and substrate; these data cannot specify biodiversity or productivity without observations.
[ecological-interactions] Interactions need controls, not just plus/minus labels: Competition limits access to a shared resource; predation or herbivory transfers matter by consumption. Mutualism benefits both partners, but seed production alone measures only the plant partner. Parasitism benefits a parasite at a host cost without necessarily killing the host immediately. Commensalism requires a benefit with no detectable effect on the other partner; failure to measure a cost is weaker than proving no cost. In this model, predators can benefit plants indirectly by reducing herbivores. The contrast is not a direct predator-to-plant feeding arrow.
[ecological-interactions] Interactions need controls, not just plus/minus labels: Model and provenance assumptions: Each row summarizes two independently assigned equal-area model plots after six weeks, with ten plants per plot and otherwise matched conditions. Seed counts are per plant means; herbivores are per plot. These are synthetic records, not an experiment with live organisms.
[ecological-interactions] Interactions need controls, not just plus/minus labels: Uncertainty and inference limits: Only two plots per condition give weak replication; plants within a plot are subsamples. A mesh exclusion could alter shade or wind, so a sham enclosure is needed before attributing its effect to missing pollinators. Both mutualist partners require measurements.

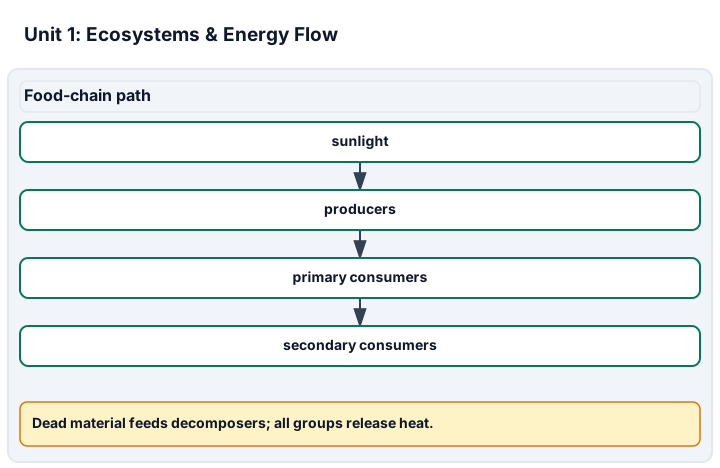
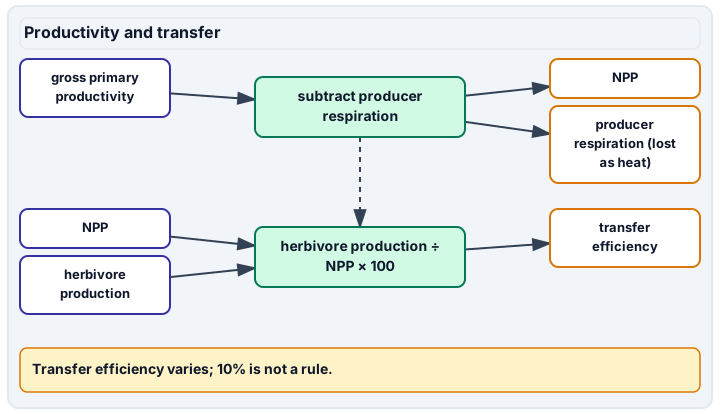
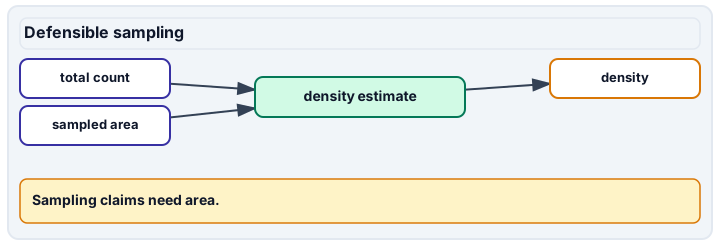
Diagram description
The food-chain path shows sunlight to producers to primary and secondary consumers. Its caption records that producers and consumers contribute dead material to decomposers, and producers, consumers and decomposers release heat. The productivity panel splits gross primary productivity into NPP and producer respiration lost as heat, then divides herbivore production by NPP to give transfer efficiency. The sampling panel computes density from total count and sampled area.
Data, provenance, and assumptions
| Community | GPP | Autotrophic respiration | Herbivore production | Carnivore production |
|---|---|---|---|---|
| Meadow | 24000 | 14000 | 1200 | 120 |
| Wetland | 30000 | 18000 | 900 | 90 |
| Plot | Area (m²) | Grass-type count | Forb-type count |
|---|---|---|---|
| A | 0.25 | 3 | 1 |
| B | 0.25 | 5 | 1 |
| C | 0.25 | 4 | 0 |
| D | 0.25 | 8 | 2 |
| Biome | Annual mean (°C) | P (mm/year) | PET (mm/year) | Dry months/year | Season/vegetation constraint |
|---|---|---|---|---|---|
| Tropical wet forest | 26 | 2400 | 1200 | 0 | Broadleaf evergreen; little thermal seasonality |
| Savanna | 25 | 1100 | 1600 | 5 | Warm year-round; dry winter; grasses and scattered trees |
| Subtropical desert | 24 | 200 | 1800 | 10 | Sparse drought-adapted vegetation |
| Chaparral | 16 | 600 | 1100 | 6 | Dry summer; wet winter; shrubs |
| Temperate grassland | 10 | 500 | 900 | 5 | Cold winter; grasses; fire and grazing |
| Temperate seasonal forest | 10 | 1000 | 700 | 1 | Deciduous canopy; winter dormancy |
| Boreal forest | 0 | 500 | 400 | 3 | Long frozen winter; conifers |
| Arctic tundra | -10 | 200 | 150 | 2 | Permafrost; short growing season; low vegetation |
| Habitat | Salinity (g/kg) | Depth (m) | Flow/light constraint |
|---|---|---|---|
| Freshwater lake | 0.1 | 20 | Seasonal stratification; bottom light may be limited |
| Freshwater river | 0.1 | 2 | Directional current and sediment transport |
| Estuary | 15 | 8 | Tidal mixing; salinity varies with river flow |
| Coral reef | 35 | 10 | Clear sunlit water; benthic habitat |
| Open ocean | 35 | 4000 | Sunlit surface above a dark deep-water habitat |
| Model condition | Herbivores/plot | Plot A seeds/plant | Plot B seeds/plant |
|---|---|---|---|
| Control | 40 | 10 | 14 |
| Pollinators excluded | 40 | 4 | 8 |
| Competing grass absent | 40 | 18 | 22 |
| Predator access | 10 | 16 | 20 |
Optional supervised observation, not an already completed lab
Scope and safety: Use an instructor-approved accessible dry site or a supplied photograph grid. Stay on permitted ground; avoid water edges, roads, allergens and unknown plants. No collecting, tasting, digging or wildlife handling.
Materials and preparation
- An approved map or photograph grid and a ruler
- Notebook with date, plot area, boundary rule, recognizable plant types and tally columns
Procedure and schedule
- Before observing, choose four nonoverlapping grid cells using a recorded random draw, or state a stratified design and the area weights.
- Count using a fixed rule for plants touching the boundary. Record zeros and uncertain identifications rather than guessing.
- Repeat one count to check counting consistency; do not call that recount a new plot. Compare densities and explain what the sampling frame excludes.
Record: Retain the map, selection method, four original tallies, area conversion, uncertainty and identification limits. Mark photo work as image analysis. Practical mastery still requires the instructor to observe the approved technique.
Worked model
Meadow NPP = 24000 − 14000 = 10000 kJ/m²/year. Herbivore transfer = 1200/10000 × 100 = 12%; carnivore transfer = 120/1200 × 100 = 10%. Combined transfer is 1.2%, not 22%. Four plots cover 1 m² and contain 24 plants, giving 24 individuals/m². [biome-comparison] Water balance is not a biome label: Wet-forest P/PET = 2400/1200 = 2. Desert P − PET = 200 − 1800 = −1600 mm/year: a potential deficit, not measured soil-water loss. Tundra P/PET = 1.333 despite low precipitation because demand is low; temperature still restricts growth. [ecological-interactions] Interactions need controls, not just plus/minus labels: Control mean = 12 seeds/plant. Pollinator exclusion gives 6, a −6 contrast; removing competing grass gives 20, a +8 contrast; predator access gives 18, a +6 contrast with fewer herbivores. These are model responses relative to the same control, not four independent field discoveries.
Numerical calibration
- 10000 kJ/m²/year
- 12 %
- 1.2 %
- 24 individuals/m²
- 8500 kJ/m²/year
- 11500 kJ/m²/year
- 2 P/PET ratio
- -1600 mm/year potential balance
- 0.8 P/PET ratio
- -6 seeds/plant contrast
- 8 seeds/plant contrast
- 6 seeds/plant contrast
- 10 seeds/plant contrast
Attempt the assigned level
Try the tasks before reading the calibration. These are practice answers, not a secure examination; use a new dataset or changed assumption for the assessed transfer.
Foundation
- Draw a producer → herbivore → carnivore chain and add decomposers. Calculate meadow NPP.
- Total each plant type across the plots and divide the total count by total sampled area.
- [biome-comparison] Water balance is not a biome label: Calculate wet-forest P/PET and the desert potential deficit. Contrast chaparral with savanna using the timing of drought and the vegetation notes.
- [ecological-interactions] Interactions need controls, not just plus/minus labels: Compute the four seed means and each treatment-minus-control contrast. Draw the predator → herbivore effect separately from the resource-to-consumer food-web arrows.
Check after your attempt
- NPP is 10000 kJ/m²/year. Arrows carry energy and matter toward consumers; decomposer respiration releases heat.
- There are 20 grass-type and 4 forb-type individuals in 1 m²: total density 24 individuals/m² and observed richness two plant types.
- [biome-comparison] Water balance is not a biome label: The ratio is 2 and the deficit is −1600 mm/year. Chaparral has a dry summer and shrubs; this savanna has a dry winter, warm conditions and grass/tree structure. Neither contrast requires a universal cutoff.
- [ecological-interactions] Interactions need controls, not just plus/minus labels: Means are 12, 6, 20 and 18 seeds/plant; contrasts are −6, +8 and +6. Predators reduce herbivores in the model, so plants can retain more tissue even though predators do not provide food to plants.
High-school core: typically grades 9-10
- Calculate both meadow transfer efficiencies and their combined efficiency. Compare wetland herbivore transfer.
- Explain why four carefully counted but roadside-only plots could still give a biased whole-site density.
- [biome-comparison] Water balance is not a biome label: Use the aquatic cards to explain why river, estuary and reef organisms face different constraints even when two cards have equal salinity.
- [ecological-interactions] Interactions need controls, not just plus/minus labels: Which comparison supports a competition hypothesis, and what is missing before declaring pollination mutualistic or an epiphyte commensal?
Check after your attempt
- Meadow efficiencies are 12%, 10%, and 1.2% combined; wetland NPP is 12000 and herbivore transfer is 7.5%. Ten percent is not exact in both systems.
- Counting precision does not remove location bias. Define the site and sample across its relevant habitat strata or limit the claim to roadsides.
- [biome-comparison] Water balance is not a biome label: River organisms face current in low salinity; estuarine organisms face changing salt concentration with tides; reef organisms depend on light and benthic structure. Reef and open ocean both have 35 g/kg but very different depth/light habitats.
- [ecological-interactions] Interactions need controls, not just plus/minus labels: Removing grass increases plant seed output by 8 seeds/plant. Mutualism also needs pollinator benefit; commensalism needs measured host response and a defensible detection limit. One partner’s response cannot determine both signs.
Honors extension: typically grades 11-12
- Bound meadow NPP using the stated independent worst-case input ranges. Bound herbivore efficiency while holding herbivore production fixed.
- Predict a plausible indirect consequence of removing a predator and propose a comparison that could challenge it.
- [biome-comparison] Water balance is not a biome label: A claimed biome classifier uses only P/PET. Challenge it with the tundra and boreal cards, and propose a seasonal observation that would improve it.
- [ecological-interactions] Interactions need controls, not just plus/minus labels: Design a safe paper-only reassignment using more independent plots, sham controls and blinded seed counts. Explain why counting twenty plants in one plot is not twenty treatment replicates.
Check after your attempt
- NPP ranges from 8500 to 11500 kJ/m²/year. Herbivore efficiency ranges from about 10.43% to 14.12%. These are bounds, not a statistical confidence interval.
- Reduced predation could increase herbivory, but resource limitation or alternative predators could alter the response. Compare matched areas over time rather than treating the diagram as a measured effect.
- [biome-comparison] Water balance is not a biome label: Both cold profiles have P/PET above one, but permafrost and winter length differ. Monthly temperature, unfrozen-soil duration and drought timing could test the classification; annual water balance does not establish a biome on its own.
- [ecological-interactions] Interactions need controls, not just plus/minus labels: Assign model plot IDs at random to treatment/sham/control, preserve the plot as the unit and hide labels during counting. Plants share plot conditions, so within-plot precision does not replace independent treatment replication.
History, reading, and writing connection
Use NOAA’s account of observations of warm Pacific waters and its modern upwelling explanation. Write a source-linked paragraph separating historical observation, the physical mechanism, and a predicted food-web consequence. Name a measurement that would test the prediction.
Write in your own words or use an approved accessible equivalent. Cite a specific assigned section or figure, identify its evidence, and state one limitation or counterargument. Use the AI practice contract only for permitted coaching, never to invent observations or write the assessed response.
Transfer to a new case
A new synthetic ecosystem has GPP 16000, producer respiration 10000, herbivore production 480 and carnivore production 96, all in kJ/m²/year. Find NPP and both transfer efficiencies. [biome-comparison] Water balance is not a biome label: A new synthetic profile has P 800 and PET 1000 mm/year, a cold winter and summer rain. Calculate P/PET and explain why the ratio cannot alone distinguish grassland from woodland. [ecological-interactions] Interactions need controls, not just plus/minus labels: In a fresh synthetic seed trial, control plots average 10 and 14 seeds/plant and predator-access plots 20 and 24. Compute the treatment contrast and identify one competing explanation to check.
Calibration: NPP is 6000; herbivore transfer is 8%; carnivore transfer is 20%. Their combined transfer is 1.6%. The changed efficiencies do not violate energy conservation. [biome-comparison] Water balance is not a biome label: P/PET is 0.8. Fire, soil, seasonal moisture and winter duration still matter; assign a conditional classification, not a universal ratio threshold. [ecological-interactions] Interactions need controls, not just plus/minus labels: The contrast is 22 − 12 = +10 seeds/plant. Unequal initial soil moisture or herbivore density could mimic a treatment response unless assignment and baseline comparability are established.
Evidence to retain
Keep an energy-flow diagram, unit-bearing budgets, sampling map or supplied-data label, density calculation, selected-level uncertainty and fresh transfer response. [biome-comparison] Water balance is not a biome label: Retain an annotated eight-biome comparison, aquatic constraint diagram and unit-bearing water ratios. Defend one failed classification and the new-profile inference against Unit 1 food-web, productivity and biome criteria. [ecological-interactions] Interactions need controls, not just plus/minus labels: Retain treatment contrasts, interaction diagrams and a plot-level replication/sham-control proposal. Use Unit 1 food-web, niche and sampling criteria; a synthetic treatment table does not pass a field-technique demonstration.
Record units, calculations, source/date, uncertainty, and what is measured versus inferred. A simulation or supplied dataset must stay labeled as such. Use supplied data or an instructor-approved supervised observation. No electrical work, combustion, radioactive materials, pesticide application, wildlife capture, microbial culture, hazardous sampling or sample ingestion is authorized.
Return to all eight learning pathways. Print this unit page for the student lessons; the linked five-page packet remains the separate assessment companion.
Unit mastery rubric
| Criterion | Developing | Proficient | Mastery |
|---|---|---|---|
| Trophic levels and food webs | Reverses resource-to-consumer arrows. | Traces a chain with prompting. | Traces energy through producers, consumers and decomposers; distinguishes energy flow from matter cycling. |
| Trophic transfer efficiency | Treats ten percent as universal. | Applies a supplied efficiency with help. | Calculates individual and combined transfer efficiencies and states the limits of the 10% approximation. |
| Primary productivity | Mixes stocks and annual flows. | Calculates NPP with reminders. | Computes NPP = GPP minus autotrophic respiration using compatible units and reports uncertainty. |
| Biomes, niches and keystone effects | Lists species without mechanisms. | Names a limiting factor. | Compares terrestrial/aquatic biome limits and ecological interactions; defends controlled contrasts and a testable keystone response. |
| Quadrat and transect technique | Omits area or selection rules. | Records plots with inconsistent boundaries. | Demonstrates approved sampling, calculates density and observed richness, and defends placement, boundary rules and limits. |
| Integration (cross-domain) | Makes no supported connection between the source and the science. | Uses the source but needs help connecting evidence, writing, or limitations to the science. | Independently connects History, Reading, and Writing using a cited source, appropriate evidence, a limitation, and a scientific explanation. |
Integration is reported separately and cannot lower the science grade or block a science demonstration pass. Science and practical criteria determine that pass. Use the integration guide's evidence checklist for the separately reported criterion.
Meadow NPP is 10000 kJ/m²/year; herbivore transfer is 12%. My four plots total 1 m² and 24 plants. I can explain selection bias, but this synthetic table is not my field observation.
Every organism gets ten percent, and four plots prove the density everywhere.
Retain supervised quadrat/transect demonstration and an oral defense. Data practice supports calculation skills; it does not automatically satisfy the practical criterion.
A 5-page clipboard packet — unit overview, key terms, the mastery rubric, anchor examples, and a score sheet you can print and grade against.