Unit 02 · Biodiversity & Populations
Measure diversity under an explicit index convention and test conditional population models. Keep sampling quality, survivorship and model assumptions visible rather than turning a single index into a verdict about ecosystem health.
Student learning: Diversity, growth limits, and what a sample can support
Choose the level by readiness, not age alone, and record it before instruction. Foundation, core, and honors tasks are study pathways, not an AP course or a promise of college credit. The instructor retains practical assessment and the published science rubric; integration is reported separately.
Prerequisites: Unit 1 sampling; proportions, squares, and interpreting expected values rather than literal fractional organisms.
Suggested sequence: read and discuss the explanation; attempt the worked model; analyze the data at your selected level; check the answers; then complete the source-linked response and a fresh transfer question. These activities supplement, not replace, supervised practical work and the full-year schedule.
Assigned reading and focus
- OpenStax Biology 2e, 45.1: Population Demography. Read Population Research Methods and the life-table and survivorship-curve sections. Identify assumptions of mark-recapture and distinguish mortality within an age interval from the number surviving to it.
- OpenStax Biology 2e, 45.3: Environmental Limits to Population Growth. Read Exponential Growth and Carrying Capacity and the Logistic Model. Compare the continuous model in the text with the explicitly discrete one-step classroom approximation below.
- EPA: DDT — A Brief History and Status. Read Development of DDT and Regulation Due to Health and Environmental Effects. Record the dated sequence of benefits, resistance, regulation and public concern; do not infer population causation from a concentration ratio alone.
- OpenStax Biology 2e: 47.1 The Biodiversity Crisis. [island-turnover] Area and isolation change turnover balance: Read patterns of biodiversity and species–area reasoning; relate area to extinction risk and isolation to the arrival pool, not to a guarantee about every island.
- OpenStax Biology 2e: 45.6 Community Ecology. [island-turnover] Area and isolation change turnover balance: Read community structure and disturbance. Distinguish changing species identity from changing richness.
- OpenStax Biology 2e: 45.6 Community Ecology. [tolerance-window] A sampled tolerance window is not a physiological limit: Read environmental influences on community structure and niches; connect physiological response to realized distribution and interactions.
- OpenStax Biology 2e: 45.1 Population Demography. [tolerance-window] A sampled tolerance window is not a physiological limit: Use the survivorship discussion to distinguish surviving individuals from reproduction and long-term population growth.
- OpenStax Biology 2e: 45.6 Community Ecology. [succession-recovery] Recovery depends on what disturbance leaves behind: Read ecological succession, primary versus secondary succession and disturbance. Distinguish a mechanism for recovery from a universal march to a fixed climax.
- OpenStax Biology 2e: 47.2 The Importance of Biodiversity to Human Life. [ecosystem-services] Flood storage, annual benefit and unpriced services: Read agricultural, wild food and ecosystem services examples. Identify provisioning, regulating and cultural benefits and the supporting processes beneath them.
- OpenStax Biology 2e: 45.1 Population Demography. [cohort-life-table] Survivorship is a proportion; mortality is conditional: Read life tables, mortality rates and survivorship curves. Identify the denominator for interval mortality and distinguish Type I/II/III sketches from complete demographic data.
- OpenStax Biology 2e: 47.3 Threats to Biodiversity. [invasive-comparison] A decline is not automatically treatment success or eradication: Read exotic species and habitat threats. Distinguish non-native origin from evidence of spread and harm; note that island and freshwater systems can be vulnerable.
Learn the science
Richness counts observed taxa; evenness describes how individuals are distributed among them. Equal richness need not mean equal diversity. Here Simpson diversity is defined as 1 − sum(p_i²), where p_i is the sample proportion of taxon i. It is the probability of different taxa in two independent draws with replacement; a higher value means greater diversity under this convention.
Other sources call sum(p_i²) itself Simpson’s index, reversing the direction. Always state the formula. Sampling effort, season and identification resolution affect comparisons; three recognizable groups do not establish the complete biodiversity of a site.
Exponential growth uses a constant per-capita rate without a density limit. Our one-year approximation to logistic growth is N_next = N + rN(1 − N/K). The continuous logistic equation is different; a large discrete time step can behave poorly. K describes conditions and resources, not a permanent property of a species or a fixed destiny.
Type I survivorship loses more individuals late in life, Type II has roughly constant mortality risk, and Type III loses many early. Generalists tolerate wider resource or habitat conditions than specialists. The historical r/K distinction summarizes life-history tendencies, not two rigid species boxes or enough information to predict every future trajectory.
The simple mark-recapture estimate is M × C/R: marked initially, caught in the second sample, and marked recaptures. It assumes closure, mixing, equal capture chances and retained recognizable marks. With zero recaptures the estimate is undefined, not zero or a reliable infinity. Use tokens or supplied data; no wildlife capture is authorized.
Succession changes communities after disturbance; recovery paths depend on soil, survivors, dispersal and subsequent disturbance. Habitat isolation can limit immigration. These ideas motivate hypotheses, but the small diversity table cannot establish a succession history or an island-biogeography relationship.
[island-turnover] Area and isolation change turnover balance: Island biogeography balances arrival of species not already present against local extinction. Isolation can lower immigration; smaller area can increase extinction through smaller populations and fewer habitats. Equilibrium richness is where the two rates match, not where either rate must be zero. This framework also motivates habitat-fragment questions, but roads, matrix habitat, rescue effects and changing habitat quality may violate a simple island analogy.
[island-turnover] Area and isolation change turnover balance: Model and provenance assumptions: Synthetic source pool has 40 species. At richness S, near immigration = 12 − 0.3S, far = 8 − 0.2S, large-island extinction = 0.1S and small-island extinction = 0.2S, all species/year. Models are used only for 0 ≤ S ≤ 40.
[island-turnover] Area and isolation change turnover balance: Uncertainty and inference limits: The rates are expected rates rather than actual annual species counts. Area and distance are varied separately in the model but can covary in real surveys. Holding slopes fixed and allowing the near intercept from 10 to 14 moves near-large equilibrium to 25–35 species, not a confidence interval.
[tolerance-window] A sampled tolerance window is not a physiological limit: A tolerance curve describes performance across an environmental gradient. Survival can be high near an optimum and poor near stress limits, but survival, growth and reproduction need not peak together. Competition can restrict a realized niche even inside a physiological tolerance range. These cards represent a seven-day survival endpoint; they cannot establish breeding success or a species’ full range.
[tolerance-window] A sampled tolerance window is not a physiological limit: Model and provenance assumptions: Each synthetic temperature has two independent model groups starting with 20 organisms each. Temperature is constant for seven days; other conditions are held fixed in the model. No organism is heated, chilled, cultured or collected.
[tolerance-window] A sampled tolerance window is not a physiological limit: Uncertainty and inference limits: Positive survival from 10 to 30 °C is only the sampled span, not the true physiological limit. Five-degree spacing leaves unsampled boundaries; zero survivors in two small groups does not establish impossibility at all exposures or life stages.
[succession-recovery] Recovery depends on what disturbance leaves behind: Primary succession begins where developed soil is absent; secondary succession begins after disturbance where soil and some propagules remain. Facilitation, competition, arrival and repeated disturbance can change the sequence. Cover can recover while composition differs from the previous community. Richness may peak then decline as a canopy closes, so one increasing variable is not proof that every ecosystem property improved.
[succession-recovery] Recovery depends on what disturbance leaves behind: Model and provenance assumptions: Synthetic records revisit the same permanent equal-area plots over twelve model years; cover and richness are group summaries. The primary case starts on bare substrate; the secondary case retains soil. They are not randomized treatments or a real recovery chronosequence.
[succession-recovery] Recovery depends on what disturbance leaves behind: Uncertainty and inference limits: Summary means omit plot dispersion, and two settings may differ in climate and seed supply. Rates are interval averages, not fixed growth constants. A disturbance reset or invasive arrival could produce a different trajectory and a different endpoint.
[ecosystem-services] Flood storage, annual benefit and unpriced services: Provisioning services include food; regulating services include flood attenuation; cultural services include recreation and place-based meaning. Soil formation and nutrient cycling support several final services. Counting both a supporting process’s full value and the same final benefit can double-count. An ecosystem’s value is not exhausted by monetized benefits, and a storage volume cannot simply be added to dollars.
[ecosystem-services] Flood storage, annual benefit and unpriced services: Model and provenance assumptions: A synthetic 10-ha wetland can temporarily hold 100 mm over its area in the modeled event. A 0.20 annual event probability multiplies $200000 avoided damage conditional on that event. Maintenance is $15000/year in fixed model dollars; no discounting is needed for this annual comparison.
[ecosystem-services] Flood storage, annual benefit and unpriced services: Uncertainty and inference limits: The rectangular storage approximation ignores outlet timing and antecedent saturation. Event probability 0.05–0.25 gives annual net benefit −$5000 to +$35000, not a statistical confidence interval. Habitat, access rights and cultural values remain outside this monetary total.
[cohort-life-table] Survivorship is a proportion; mortality is conditional: For an initial female cohort n₀, survivorship lₓ = nₓ/n₀. Deaths in an interval are dₓ = nₓ − nₓ₊₁, while conditional mortality qₓ = dₓ/nₓ uses only those alive at its start. Net reproductive rate R₀ = sum(lₓmₓ) counts expected daughters per initial female over the specified life history. R₀ is not an annual growth rate: timing of reproduction matters. Survivorship-curve shapes summarize patterns, not rigid rules for all individuals of a taxon.
[cohort-life-table] Survivorship is a proportion; mortality is conditional: Model and provenance assumptions: The synthetic closed cohort starts with 100 females, followed at integer-year ages to death; mₓ is daughters per surviving female during the following one-year interval, excluding the final empty interval. No immigration, emigration or double counting of daughters is modeled.
[cohort-life-table] Survivorship is a proportion; mortality is conditional: Uncertainty and inference limits: If age-two survivors range from 45 to 55 with other inputs fixed, R₀ ranges 1.4–1.6. Counts at different ages belong to the same cohort, not independent samples; mortality patterns and reproductive timing would need separate cohorts for a population forecast.
[invasive-comparison] A decline is not automatically treatment success or eradication: An introduced species is not automatically invasive; spread and ecological or other harm need evidence. A before–after/control–impact (BACI) comparison subtracts background change in comparison sites from change at treatment sites. It improves a simple before/after description but does not automatically remove nonrandom site choice or different trends. Repeated nondetections can reduce uncertainty about presence, yet they do not prove absence when detection is imperfect.
[invasive-comparison] A decline is not automatically treatment success or eradication: Model and provenance assumptions: The synthetic record has two independent treatment and two comparison sites, each surveying 100 m² by the same recognition protocol before and one season after an unspecified approved management program. No control method, collection or organism transport is assigned.
[invasive-comparison] A decline is not automatically treatment success or eradication: Uncertainty and inference limits: Two sites per group are not enough for strong generalization; repeated counts inside a site are not new sites. Detection is assumed independent between three visits only for the probability model. Changing visibility, weather or observers can invalidate that assumption.

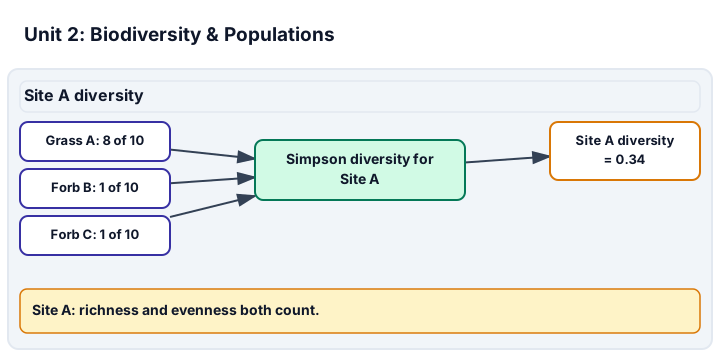
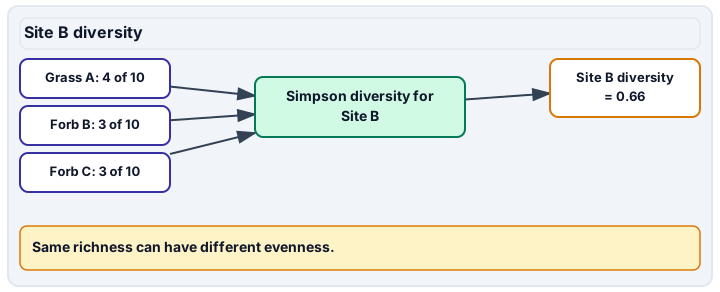
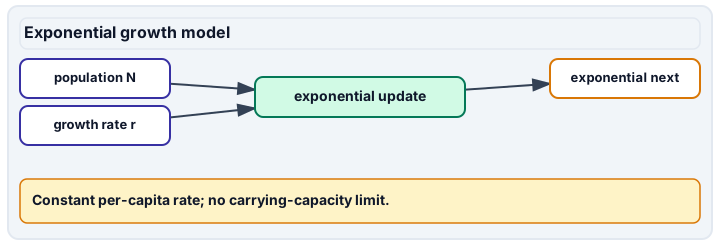
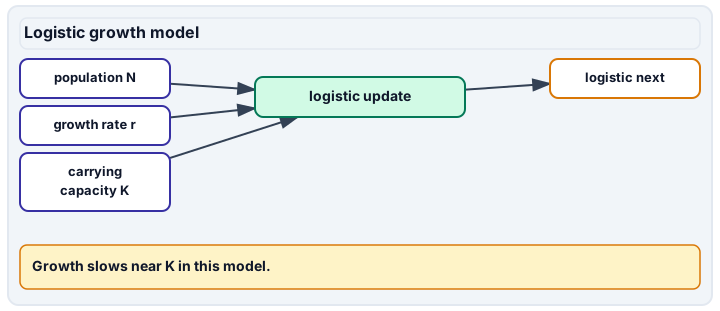
Diagram description
Site A and Site B panels compute Simpson diversity from Grass A, Forb B and Forb C counts, showing how equal richness can differ in evenness. The growth panels compare exponential and logistic expectations using N and r; only the logistic panel uses carrying capacity K.
Data, provenance, and assumptions
| Taxon | Site A count | Site B count |
|---|---|---|
| Grass A | 8 | 4 |
| Forb B | 1 | 3 |
| Forb C | 1 | 3 |
| Case index | N (individuals) | K (individuals) | r (/year) |
|---|---|---|---|
| 1 | 20 | 100 | 0.2 |
| 2 | 50 | 100 | 0.2 |
| 3 | 90 | 100 | 0.2 |
| Initially marked M | Second sample C | Marked recaptures R |
|---|---|---|
| 20 | 25 | 5 |
| Richness S (species) | Near immigration (species/year) | Far immigration (species/year) | Large extinction (species/year) | Small extinction (species/year) |
|---|---|---|---|---|
| 0 | 12 | 8 | 0 | 0 |
| 10 | 9 | 6 | 1 | 2 |
| 20 | 6 | 4 | 2 | 4 |
| 30 | 3 | 2 | 3 | 6 |
| 40 | 0 | 0 | 4 | 8 |
| Temperature (°C) | Replicate A survivors | Replicate B survivors | Initial organisms/replicate |
|---|---|---|---|
| 5 | 0 | 0 | 20 |
| 10 | 8 | 10 | 20 |
| 15 | 16 | 18 | 20 |
| 20 | 18 | 20 | 20 |
| 25 | 12 | 14 | 20 |
| 30 | 2 | 4 | 20 |
| 35 | 0 | 0 | 20 |
| Years since disturbance | Primary plant cover (%) | Secondary plant cover (%) | Secondary richness (taxa/plot) | Secondary soil carbon (kg C/m²) |
|---|---|---|---|---|
| 0 | 0 | 20 | 4 | 1.2 |
| 2 | 5 | 50 | 12 | 1.3 |
| 6 | 20 | 80 | 16 | 1.6 |
| 12 | 45 | 95 | 12 | 2 |
| Site | Area (ha) | Available depth (mm/event) | Event probability/year | Avoided damage ($/event) | Maintenance ($/year) |
|---|---|---|---|---|---|
| Wetland model | 10 | 100 | 0.2 | 200000 | 15000 |
| Age x (years) | nₓ survivors | mₓ daughters/survivor/interval |
|---|---|---|
| 0 | 100 | 0 |
| 1 | 80 | 0.5 |
| 2 | 50 | 2 |
| 3 | 10 | 1 |
| 4 | 0 | 0 |
| Group | Site ID | Sampled area (m²) | Before individuals | After individuals |
|---|---|---|---|---|
| Treatment | A | 100 | 12 | 6 |
| Treatment | B | 100 | 8 | 4 |
| Comparison | C | 100 | 10 | 12 |
| Comparison | D | 100 | 6 | 10 |
Worked model
Both sites have richness three and N = 10. Site A diversity = 1 − (0.8² + 0.1² + 0.1²) = 0.34; Site B = 1 − (0.4² + 0.3² + 0.3²) = 0.66. For N = 50, logistic next-year expectation is 50 + 0.2 × 50 × 0.5 = 55, versus exponential 60. Recapture estimate = 20 × 25/5 = 100 tokens. [island-turnover] Area and isolation change turnover balance: Near-large equilibrium solves 12 − 0.3S = 0.1S: S = 30, with three arrivals and three extinctions per year. Far-small solves 8 − 0.2S = 0.2S: S = 20, with four of each. Equal richness next year would not prove that the species identities stayed unchanged. [tolerance-window] A sampled tolerance window is not a physiological limit: At 20 °C, 38 of 40 survive: 95%. At 10 °C, 18/40 = 45%. The span with any survivors is 30 − 10 = 20 °C; that is an observed-in-the-model interval width, not the highest tolerable temperature or a confidence interval. [succession-recovery] Recovery depends on what disturbance leaves behind: Secondary cover grows from 50% to 80% between years 2 and 6: 30 percentage points/4 years = 7.5 points/year. From years 6 to 12, cover increases but richness falls 16 to 12. Recovery cannot be summarized by one monotonic “health” score. [ecosystem-services] Flood storage, annual benefit and unpriced services: Storage = 10 × 10000 × 0.1 = 10000 m³/event. Expected annual net monetary benefit = 0.20 × 200000 − 15000 = $25000/year. Break-even event probability is 15000/200000 = 0.075/year. Do not add a second dollar value for storage if the avoided damage already arises from that storage. [cohort-life-table] Survivorship is a proportion; mortality is conditional: l₂ = 50/100 = 0.5. From age 1 to 2, d₁ = 30 but q₁ = 30/80 = 0.375, not 0.30. R₀ = 1×0 + 0.8×0.5 + 0.5×2 + 0.1×1 = 1.5 daughters per initial female. At age 4 the zero denominator makes q₄ undefined, not zero. [invasive-comparison] A decline is not automatically treatment success or eradication: Treatment mean change = (−6−4)/2 = −5 individuals/100 m²; comparison = (2+4)/2 = +3. Adjusted change = −8 individuals/100 m² over the season. If detection probability is 0.5 per independent visit given presence, three misses have probability 0.5³ = 0.125; that is not the probability of absence.
Numerical calibration
- 0.34 defined Simpson diversity
- 0.66 defined Simpson diversity
- 55 expected individuals
- 60 expected individuals
- 100 estimated tokens
- 30 expected species
- 20 expected species
- 25 expected species, low-intercept scenario
- 35 expected species, high-intercept scenario
- 20 expected species
- 95 % seven-day survival
- 20 °C sampled span
- 75 % seven-day survival
- 7.5 cover percentage points/year
- 5 cover percentage points/year
- 10000 m³/event
- 25000 $/year expected net benefit
- 0.075 annual event probability at monetary break-even
- -5000 $/year net benefit at annual event probability 0.05
- 35000 $/year net benefit at annual event probability 0.25
- 5000 $/year expected net benefit
- 0.5 fraction of initial cohort
- 0.375 fraction alive at age one dying before two
- 1.5 daughters/initial female/lifetime
- 1.4 daughters/initial female/lifetime with 45 age-two survivors
- 1.6 daughters/initial female/lifetime with 55 age-two survivors
- 0.9 daughters/initial female/lifetime
- -8 individuals/100 m² seasonal contrast
- 0.125 probability of three misses given presence
- 0.421875 probability of three misses given presence
Attempt the assigned level
Try the tasks before reading the calibration. These are practice answers, not a secure examination; use a new dataset or changed assumption for the assessed transfer.
Foundation
- Compare richness and dominance at A and B. Compute all sample proportions.
- Identify what N, r and K mean; explain why the expected count 23.2 for the first case is not a claim about a fraction of a real animal.
- [island-turnover] Area and isolation change turnover balance: Find the two rate intersections for near-large and far-small islands. Explain why nonzero turnover is not a contradiction of equilibrium richness.
- [tolerance-window] A sampled tolerance window is not a physiological limit: Calculate pooled survival at 10 and 20 °C and plot survival against temperature. Label initial count, duration and response variable.
- [succession-recovery] Recovery depends on what disturbance leaves behind: Identify the primary versus secondary starting condition and calculate secondary cover change per year from year 2 to 6.
- [ecosystem-services] Flood storage, annual benefit and unpriced services: Calculate event storage and expected annual net monetary benefit. Classify food harvest, flood attenuation and recreation by the service each provides.
- [cohort-life-table] Survivorship is a proportion; mortality is conditional: Construct lₓ, dₓ and qₓ for ages 0–3. Explain why the death count 30 in interval 1–2 is not the same number as either mortality proportion.
- [invasive-comparison] A decline is not automatically treatment success or eradication: Calculate site changes and the difference between treatment and comparison mean changes. State the area and time interval.
Check after your attempt
- Both have richness three. A proportions are 0.8, 0.1, 0.1; B proportions are 0.4, 0.3, 0.3. B is more even.
- N is current abundance, r the model rate and K the condition-dependent capacity. A numerical expectation can be noninteger even though observed counts are integers.
- [island-turnover] Area and isolation change turnover balance: Near-large balances at 30 species and far-small at 20. Replacement can change identities while the expected number stays constant; equilibrium does not imply no extinctions.
- [tolerance-window] A sampled tolerance window is not a physiological limit: Survival is 45% and 95% respectively over seven days, using 40 initial organisms at each temperature. Survivor count alone should not be plotted as a growth rate.
- [succession-recovery] Recovery depends on what disturbance leaves behind: Primary begins without developed soil, secondary retains soil. Secondary cover changes 30 percentage points over four years, or 7.5 points/year, not 7.5 percent relative growth.
- [ecosystem-services] Flood storage, annual benefit and unpriced services: Storage is 10000 m³/event and annual net benefit $25000. Food is provisioning, flood attenuation regulating and recreation cultural; these labels do not make their units interchangeable.
- [cohort-life-table] Survivorship is a proportion; mortality is conditional: lₓ = 1, 0.8, 0.5, 0.1; dₓ = 20, 30, 40, 10; qₓ = 0.20, 0.375, 0.80, 1. Deaths are counts; 0.30 uses the initial cohort, while conditional 0.375 uses the 80 alive at age 1.
- [invasive-comparison] A decline is not automatically treatment success or eradication: Changes are −6, −4, +2 and +4 per 100 m² over one season. Treatment-minus-comparison change is −5 − 3 = −8 individuals/100 m², not a percent decrease in the regional population.
High-school core: typically grades 9-10
- Calculate the defined diversity values and logistic expectations for all three cases.
- Estimate the recapture population and list four conditions that would make the estimator unreliable.
- [island-turnover] Area and isolation change turnover balance: At S = 10 on a near-large island, calculate expected net change over one short year. State why repeatedly adding that same number would fail.
- [tolerance-window] A sampled tolerance window is not a physiological limit: State the sampled span with positive survival and explain why 35 °C cannot be declared a universal lethal boundary.
- [succession-recovery] Recovery depends on what disturbance leaves behind: Use years 6–12 to challenge the claim that succession always increases richness. Explain why high cover is not necessarily the original species composition.
- [ecosystem-services] Flood storage, annual benefit and unpriced services: Calculate the break-even annual event probability and explain a double-counting error involving floodwater storage and avoided damage.
- [cohort-life-table] Survivorship is a proportion; mortality is conditional: Calculate R₀ and explain whether its value supplies a calendar-year population increase. Identify the terminal zero-denominator problem.
- [invasive-comparison] A decline is not automatically treatment success or eradication: Explain why an adjusted decline is not proof of treatment causation or eradication. Name a native-community response to monitor alongside invader counts.
Check after your attempt
- Diversity is 0.34 at A and 0.66 at B. Logistic expectations are 23.2, 55 and 91.8; growth slows near K in this model.
- The estimate is 100. Migration, poor mixing, lost marks or unequal capture probability can bias it; sample uncertainty remains even if assumptions hold.
- [island-turnover] Area and isolation change turnover balance: Immigration 9 minus extinction 1 gives +8 species/year and a one-step expectation of 18. Rates change as richness changes and the pool has only 40 species, so constant increments are not the model.
- [tolerance-window] A sampled tolerance window is not a physiological limit: Positive model survival occurs at sampled temperatures 10–30 °C, a 20 °C span. Duration, stage, acclimation and unsampled temperatures differ; small synthetic groups do not establish a universal lethal boundary.
- [succession-recovery] Recovery depends on what disturbance leaves behind: Cover rises 80% to 95% while richness falls 16 to 12 taxa/plot. Dominance and arrival can change identity even when vegetation fills space, so composition and function need separate measurements.
- [ecosystem-services] Flood storage, annual benefit and unpriced services: Break-even is 0.075/year. Monetizing stored water as flood protection and adding the full avoided flood damage again can count the same endpoint twice; report volume separately unless distinct benefits are justified.
- [cohort-life-table] Survivorship is a proportion; mortality is conditional: R₀ is 1.5 daughters per initial female across life, not a 50% annual growth rate. Reproductive age distribution and future vital rates matter. The empty age-four interval has undefined conditional mortality.
- [invasive-comparison] A decline is not automatically treatment success or eradication: Site choice, weather and baseline trends can differ; remaining plants and imperfect detection preclude eradication claims. Native recruitment or standardized richness could test whether lower invader counts accompany ecological recovery.
Honors extension: typically grades 11-12
- Recalculate the middle case if drought changes K to 40. Explain why a new independent sample is needed to compare real growth models.
- For the original recapture counts, test R = 4 and R = 6; explain the sensitivity and the R = 0 boundary.
- [island-turnover] Area and isolation change turnover balance: Solve the near-large equilibrium for immigration intercepts 10 and 14. Propose matched-site evidence separating distance from habitat area.
- [tolerance-window] A sampled tolerance window is not a physiological limit: Propose a paper-only extension that distinguishes survival tolerance from reproductive performance and separates temperature from salinity.
- [succession-recovery] Recovery depends on what disturbance leaves behind: Design an inland/photo-record comparison that distinguishes an actual repeated-plot record from a space-for-time chronosequence and tests a disturbance reset.
- [ecosystem-services] Flood storage, annual benefit and unpriced services: Recalculate net benefits at probabilities 0.05 and 0.25. Under a $20000 annual budget, identify what evidence and distributional questions remain before choosing restoration.
- [cohort-life-table] Survivorship is a proportion; mortality is conditional: Bound R₀ with age-two survivors 45–55 and other entries fixed. Compare what equal R₀ but later reproduction would imply for calendar-time growth.
- [invasive-comparison] A decline is not automatically treatment success or eradication: Compute the probability of three nondetections given presence and detection 0.5 per independent visit. Why is that not a posterior probability that the invader is absent?
Check after your attempt
- The one-year expectation becomes 47.5. A fitted model must be tested on withheld or new observations; the classroom table was generated, not fitted.
- Estimates are 125 and about 83.33. Small recapture counts give unstable estimates; zero recaptures make this formula undefined. Do not trap or mark animals for this exercise.
- [island-turnover] Area and isolation change turnover balance: Equilibria are 25 and 35 species because the combined slope is 0.4/year. Compare independently sampled islands across crossed area/distance categories with similar effort and habitat quality; one near-large/far-small pair confounds both factors.
- [tolerance-window] A sampled tolerance window is not a physiological limit: Request independently replicated records crossing temperature and salinity, with a separate offspring-per-survivor endpoint and fixed duration. More repeated readings of one group are not more independent groups; no exposure experiment is assigned.
- [succession-recovery] Recovery depends on what disturbance leaves behind: Track identified plots across dated images using fixed area and recognition rules; report visibility limits. A chronosequence substitutes different sites for time and assumes comparable starting conditions. A new disturbance should be recorded, not erased to preserve a smooth curve.
- [ecosystem-services] Flood storage, annual benefit and unpriced services: Net benefits range from −$5000 to +$35000/year and $15000 maintenance fits the budget. Hydrologic timing, affected households, access and unpriced habitat benefits still matter; the central estimate is not a compulsory policy verdict.
- [cohort-life-table] Survivorship is a proportion; mortality is conditional: R₀ spans 0.4 + 0.45×2 + 0.1 = 1.4 to 1.6. Delayed reproduction can slow calendar-time growth even at the same lifetime replacement; these sensitivity bounds are not a confidence interval.
- [invasive-comparison] A decline is not automatically treatment success or eradication: The miss probability is 0.125 conditional on presence. A posterior absence probability also needs prior occupancy and a detection model; correlated visits would change the calculation.
History, reading, and writing connection
Construct a dated sequence from EPA’s DDT history: early uses, resistance and regulatory concern, Carson’s 1962 publication, EPA’s creation in 1970, and the 1972 cancellation order. Explain why benefits and harms both belong in an evidence-based account. A single author did not alone create an agency or prove every ecological effect.
Write in your own words or use an approved accessible equivalent. Cite a specific assigned section or figure, identify its evidence, and state one limitation or counterargument. Use the AI practice contract only for permitted coaching, never to invent observations or write the assessed response.
Transfer to a new case
A third synthetic site has two taxa with counts 5 and 5. Is its defined Simpson diversity higher than Site A’s despite lower richness? [island-turnover] Area and isolation change turnover balance: A new synthetic fragment model has immigration 12 − 0.2S and extinction 0.4S species/year within a 40-species pool. Solve its equilibrium and explain why a corridor could alter more than immigration. [tolerance-window] A sampled tolerance window is not a physiological limit: At a new synthetic temperature, two groups of 20 have 14 and 16 survivors after seven days. Find pooled survival and explain why this point alone cannot locate the optimum. [succession-recovery] Recovery depends on what disturbance leaves behind: A new synthetic secondary site moves from 50% cover at year 8 to 70% at year 12 while richness stays 10 taxa. Find the average cover rate and state what did not change. [ecosystem-services] Flood storage, annual benefit and unpriced services: A fresh risk revision changes annual event probability to 0.10, retaining $200000 avoided damage per event and $15000 annual maintenance. Find annual net benefit without changing the storage calculation. [cohort-life-table] Survivorship is a proportion; mortality is conditional: A new closed synthetic cohort has l₁ = 0.6, m₁ = 0.5, l₂ = 0.3 and m₂ = 2, with zero reproduction at other ages. Find R₀ and state its denominator. [invasive-comparison] A decline is not automatically treatment success or eradication: A cryptic invader has detection probability 0.25 on each of three independent supplied-record visits. Find the probability of three misses given presence, without turning it into an absence probability.
Calibration: Yes: 1 − (0.5² + 0.5²) = 0.5, versus 0.34 at A. Different metrics answer different questions; equal effort and identification remain necessary. [island-turnover] Area and isolation change turnover balance: Equilibrium is 12/0.6 = 20 species. A corridor could also change rescue, predators or invasive arrivals; the single-rate intervention assumption needs testing. [tolerance-window] A sampled tolerance window is not a physiological limit: Pooled survival is 30/40 = 75%. The optimum requires comparison across temperatures and endpoints; one new point cannot establish it. [succession-recovery] Recovery depends on what disturbance leaves behind: The average rate is 20/4 = 5 percentage points/year. Observed richness stayed 10, but species identities could still have changed. [ecosystem-services] Flood storage, annual benefit and unpriced services: Net benefit becomes $5000/year. Event storage remains 10000 m³; a changed event frequency alters expected annual benefit, not geometry. [cohort-life-table] Survivorship is a proportion; mortality is conditional: R₀ = 0.6×0.5 + 0.3×2 = 0.9 daughters per initial female over life. It does not by itself predict a specific year’s population. [invasive-comparison] A decline is not automatically treatment success or eradication: Three misses have probability 0.75³ = 0.421875 given presence. A nondetection record can therefore remain quite compatible with presence; no capture or risky field search is required.
Evidence to retain
Submit the explicit diversity convention, counts and denominators, model calculations, closure assumptions, a hypothetical or approved sampling plan, and a limitation. Never invent a capture record. [island-turnover] Area and isolation change turnover balance: Retain labeled rate curves, equilibrium equations, nonzero-turnover explanation and a matched-island sampling proposal. Use Unit 2 richness, model and capacity criteria; no trip to an island or organism movement is needed. [tolerance-window] A sampled tolerance window is not a physiological limit: Keep the response graph with sample denominators and duration, a sampled-boundary caveat, and an independent-record design. This supports Unit 2 population/capacity and data technique, not credit for harming or handling organisms. [succession-recovery] Recovery depends on what disturbance leaves behind: Retain two labeled succession trajectories, an interval-rate calculation and a composition-versus-cover critique. Use Unit 2 richness, model and capacity criteria; a photo sequence is not a completed field restoration. [ecosystem-services] Flood storage, annual benefit and unpriced services: Keep a service/process map, volume and annual-benefit calculations, sensitivity range and one unpriced or distributional concern. Link the model to Unit 2 biodiversity/capacity evidence rather than grading a preferred restoration policy. [cohort-life-table] Survivorship is a proportion; mortality is conditional: Retain the completed life table, interval denominators, lifetime reproduction sum and fresh-cohort defense. Assess Unit 2 population models, life histories and data handling without turning paper analysis into a capture record. [invasive-comparison] A decline is not automatically treatment success or eradication: Retain site-level changes, a BACI diagram, imperfect-detection calculation and a native-response monitoring proposal. These address Unit 2 diversity, population, capacity and sampling criteria without claiming eradication or performed fieldwork.
Record units, calculations, source/date, uncertainty, and what is measured versus inferred. A simulation or supplied dataset must stay labeled as such. Use supplied data or an instructor-approved supervised observation. No electrical work, combustion, radioactive materials, pesticide application, wildlife capture, microbial culture, hazardous sampling or sample ingestion is authorized.
Return to all eight learning pathways. Print this unit page for the student lessons; the linked five-page packet remains the separate assessment companion.
Unit mastery rubric
| Criterion | Developing | Proficient | Mastery |
|---|---|---|---|
| Richness and evenness | Conflates richness and dominance. | Counts taxa but misses dominance. | Compares richness/evenness, succession and ecosystem services using equal-effort records; identifies sampling, identity and valuation limits. |
| Defined diversity index | Omits the formula or denominator. | Calculates with help. | Calculates and interprets a stated Simpson or Shannon convention; checks which direction means greater diversity. |
| Population growth models | Assumes unlimited growth. | Labels curves without testing them. | Compares growth, island turnover and disturbance/invasion models; tests conditional predictions against independent records. |
| Capacity and life histories | Treats K as permanently fixed. | Names survivorship patterns. | Relates capacity, tolerance, life tables and generalist/specialist strategies to conditional predictions; distinguishes lifetime and annual rates. |
| Sampling and recapture technique | Ignores placement or recapture assumptions. | Records counts with prompting. | Demonstrates approved quadrat or token-recapture work, calculates an estimate, and identifies bias and zero-recapture limits. |
| Integration (cross-domain) | Makes no supported connection between the source and the science. | Uses the source but needs help connecting evidence, writing, or limitations to the science. | Independently connects History, Reading, and Writing using a cited source, appropriate evidence, a limitation, and a scientific explanation. |
Integration is reported separately and cannot lower the science grade or block a science demonstration pass. Science and practical criteria determine that pass. Use the integration guide's evidence checklist for the separately reported criterion.
Both sites contain three taxa, but my stated 1 − sum(p²) convention gives 0.34 and 0.66. I cannot attribute this difference to a pollutant without comparable sampling and other evidence.
The larger Simpson number proves this site has more species and no pollution.
Keep a supervised sampling demonstration or explicitly approved equivalent. Token recapture is a model, not animal-fieldwork credit, and no wildlife handling is authorized here.
A 5-page clipboard packet — unit overview, key terms, the mastery rubric, anchor examples, and a score sheet you can print and grade against.