Unit 03 · Biogeochemical Cycles
Connect water, carbon and nutrient cycles to solar, gravitational and solid-Earth drivers. Calculate a storage change and a mass flux without mistaking concentration for load or a modeled balance for proof of a human source.
Student learning: Earth-system drivers, reservoirs, and measured fluxes
Choose the level by readiness, not age alone, and record it before instruction. Foundation, core, and honors tasks are study pathways, not an AP course or a promise of college credit. The instructor retains practical assessment and the published science rubric; integration is reported separately.
Prerequisites: Units 1–2; conservation, volume and time units, and inputs-minus-outputs accounting.
Suggested sequence: read and discuss the explanation; attempt the worked model; analyze the data at your selected level; check the answers; then complete the source-linked response and a fresh transfer question. These activities supplement, not replace, supervised practical work and the full-year schedule.
Assigned reading and focus
- USGS Water Science School: The Water Cycle. Read Pools store water, Fluxes move water between pools, What drives the water cycle?, and Humans alter the water cycle. Label a system boundary before calculating a storage change.
- OpenStax Biology 2e, 46.3: Biogeochemical Cycles. Read the carbon, nitrogen and phosphorus cycle sections and trace fixation, assimilation, ammonification, nitrification and denitrification. Distinguish a large reservoir from a rapid flow.
- USGS This Dynamic Earth: Understanding Plate Motions. Read the four boundary definitions and Divergent boundaries, then inspect the convergent/transform diagrams. Explain how uplift, volcanism and weathering connect the solid Earth to cycles.
- NASA Space Place: What Causes the Seasons?. Read the explanation of axial tilt and compare the two hemisphere diagrams. Separate changing solar angle and day length from a change in Earth–Sun distance.
- Met Office: Global circulation patterns. [wind-rain-shadow] Latitude, moving air and a mountain barrier: Read unequal heating, circulation and the Coriolis effect. Sketch pressure belts and explain why winds are named for where they come from, not where they go.
Learn the science
A reservoir is an amount at a time; a flux is an amount per time. Over a defined interval, change in storage equals inputs minus outputs. The catchment here includes surface water and the root zone but excludes the deep aquifer: recharge leaves this boundary. It would be an internal transfer, not a loss, in a larger system including that aquifer.
Solar energy drives evaporation and uneven surface heating; gravity drives precipitation, downhill flow and groundwater motion along hydraulic gradients. Earth’s rotation deflects moving air and water. Tilt changes solar angle and day length with season; distance from the Sun does not explain opposite seasons in the hemispheres.
Earth’s internal heat and gravity help drive plate motions and the rock cycle. Divergence can form new ocean crust; subduction recycles it, continental collisions build mountains, and transform motion slides boundaries past one another. Uplift and weathering expose minerals and release nutrients. These processes operate on different timescales from daily weather or fertilizer application.
Photosynthesis moves carbon into organic matter; respiration and decomposition return it, oceans exchange it, and fossil carbon is stored on geological timescales. Combustion moves stored carbon to the atmosphere. In a simplified atmospheric ledger, emissions minus net land and ocean uptake give the stock change; gross natural exchanges must not be double counted as net uptake.
Most organisms cannot directly use atmospheric N₂. Fixation converts it to biologically available reduced nitrogen; industry also fixes nitrogen using the energy-intensive Haber–Bosch process. Assimilation incorporates nitrogen in organisms, ammonification returns ammonium, nitrification oxidizes it toward nitrate, and denitrification can return nitrate nitrogen to gases under low-oxygen conditions.
Phosphorus weathering, uptake and sedimentation link rocks to organisms and water. There is no major gaseous reservoir in the phosphorus cycle, but windblown dust can transport phosphorus through the atmosphere. A claim of no atmospheric transport at all would be too strong.
Concentration alone cannot give a mass flux. Multiply concentration by the water volume passing per time and retain conversions: mg/L × m³/s × 1000 L/m³ × 86400 s/day ÷ 1000000 mg/kg. A nitrate result must specify whether it is reported as nitrogen or as nitrate; this course table uses mg N/L.
[wind-rain-shadow] Latitude, moving air and a mountain barrier: Differential heating helps produce rising moist air near the equatorial convergence zone and descending air near subtropical highs. Rotation deflects motion to the right in the Northern Hemisphere and left in the Southern Hemisphere, organizing trades, westerlies and polar easterlies. Continents, seasonal shifts and ocean currents disturb the zonal sketch. A mountain can force air upward to cool, condense and lose moisture; descending air warms, producing a possible rain shadow even at the same latitude.
[wind-rain-shadow] Latitude, moving air and a mountain barrier: Model and provenance assumptions: Wind cards are idealized near-surface belts, not a weather forecast. A synthetic parcel starts at sea level at 24 °C, reaches cloud base at 1 km and a summit at 2 km. Use fixed dry cooling 10 °C/km and saturated cooling 6 °C/km; after condensation, assume dry descent.
[wind-rain-shadow] Latitude, moving air and a mountain barrier: Uncertainty and inference limits: Actual saturated lapse rates depend on moisture and temperature, and air can mix or follow different paths. This model calculates temperature, not rainfall quantity. Shifting cloud base by 0.5 km changes the result; geography and moisture matter beyond latitude.

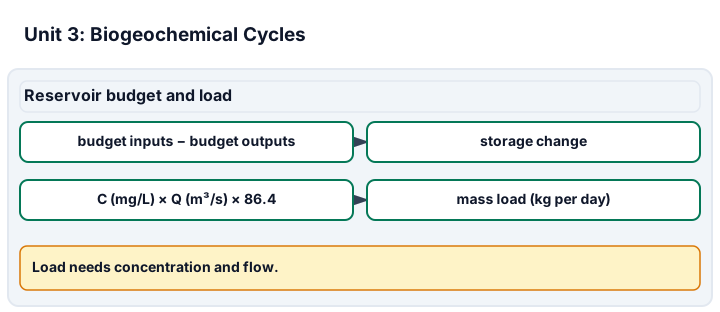
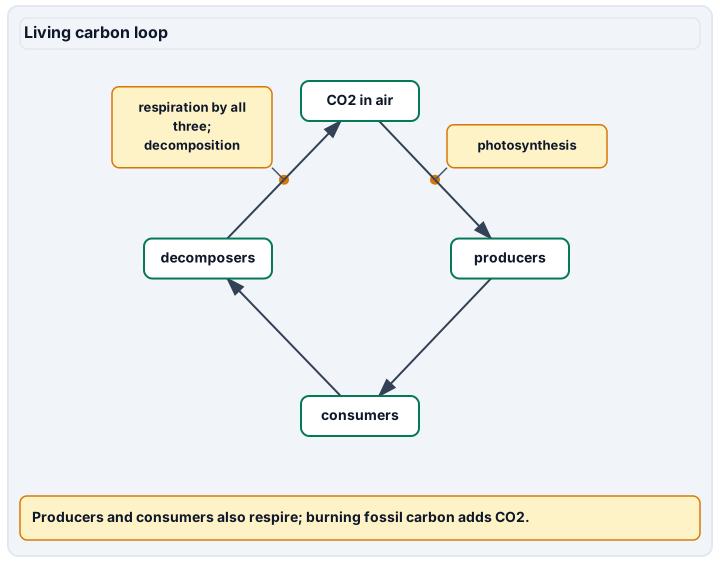
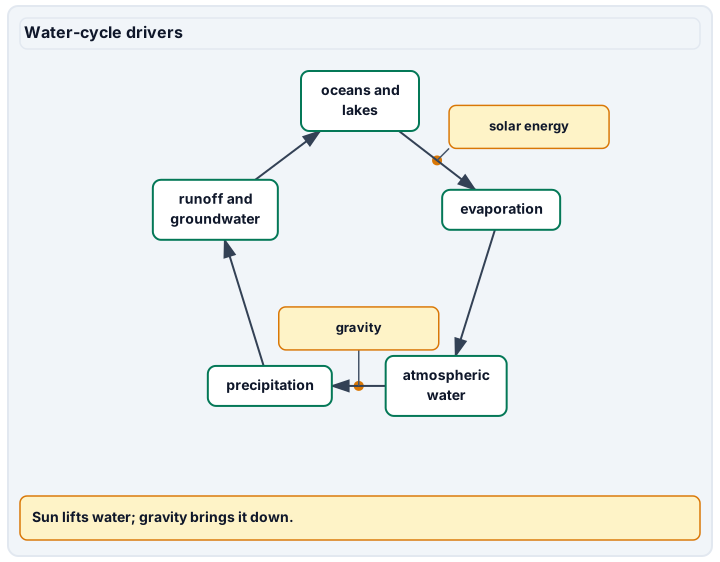
Diagram description
The budget panel shows storage change as budget inputs minus budget outputs, and mass load as concentration times flow times 86.4 in kilograms per day. Carbon moves from CO2 to producers by photosynthesis; producers feed consumers and dead material from producers and consumers feeds decomposers; producers, consumers and decomposers return CO2 by respiration and decomposition. Burning (combustion) moves stored fossil carbon to CO2 in the air, and CO2 also exchanges between the air and the ocean. In the water cycle, solar energy drives evaporation from oceans and lakes into atmospheric water; gravity brings it down as precipitation, and runoff and groundwater return it to oceans and lakes.
Data, provenance, and assumptions
| Precipitation (mm/year) | Evapotranspiration (mm/year) | Runoff (mm/year) | Deep recharge (mm/year) | Area (km²) |
|---|---|---|---|---|
| 1000 | 600 | 250 | 120 | 2 |
| Initial stock (Gt C) | Combustion input (Gt C/year) | Net land uptake (Gt C/year) | Net ocean uptake (Gt C/year) |
|---|---|---|---|
| 900 | 10 | 3 | 2 |
| Nitrate (mg N/L) | Flow (m³/s) | Duration (s/day) |
|---|---|---|
| 2 | 0.5 | 86400 |
| Latitude band | Near-surface belt | Travel direction | Broad pressure path |
|---|---|---|---|
| 0–30° N | Northeast trades | NE → SW | Subtropical high toward equatorial low |
| 30–60° N | Westerlies | SW → NE | Subtropical high toward subpolar low |
| 60–90° N | Polar easterlies | NE → SW | Polar high toward subpolar low |
| 0–30° S | Southeast trades | SE → NW | Subtropical high toward equatorial low |
| 30–60° S | Westerlies | NW → SE | Subtropical high toward subpolar low |
| 60–90° S | Polar easterlies | SE → NW | Polar high toward subpolar low |
| Initial temperature (°C) | Cloud base (km) | Summit (km) | Dry lapse (°C/km) | Saturated lapse (°C/km) |
|---|---|---|---|---|
| 24 | 1 | 2 | 10 | 6 |
Worked model
Water storage change = 1000 − 600 − 250 − 120 = +30 mm/year. Over 2 km² that is 0.03 m × 2000000 m² = 60000 m³ added in one year. Atmospheric carbon increases by 10 − 3 − 2 = 5 Gt C. River nitrogen load is 2 × 0.5 × 86.4 = 86.4 kg N/day. [wind-rain-shadow] Latitude, moving air and a mountain barrier: At cloud base the parcel is 24 − 10 = 14 °C. At the summit it is 14 − 6 = 8 °C. Dry descent through 2 km gives 8 + 20 = 28 °C at the lee sea-level site, 4 °C warmer than the starting side. Latent heat and moisture loss matter; a mountain does not create energy.
Numerical calibration
- 30 mm/year
- 60000 m³ added in one year
- -100 mm/year
- 160 mm/year
- 5 Gt C/year
- 86.4 kg N/day
- 8 °C
- 28 °C
- 30 °C
Attempt the assigned level
Try the tasks before reading the calibration. These are practice answers, not a secure examination; use a new dataset or changed assumption for the assessed transfer.
Foundation
- Draw the boundary of the water budget and show why recharge is an output here. Calculate the central storage change.
- Draw four cycle diagrams, distinguishing carbon combustion, nitrogen fixation, phosphorus weathering and evaporation. Identify the energy or physical driver.
- [wind-rain-shadow] Latitude, moving air and a mountain barrier: Sketch the six near-surface wind belts using travel arrows and label rising versus descending zones. Compute cloud-base and summit temperatures.
Check after your attempt
- The central change is +30 mm/year. The deep aquifer is outside this chosen boundary, even though the recharge water still exists in the larger Earth system.
- Water movement uses solar energy and gravity; weathering exposes rock nutrients; microbial and industrial processes transform nitrogen. Cycling matter is not creation of new atoms.
- [wind-rain-shadow] Latitude, moving air and a mountain barrier: Trades converge toward the equator and subtropical air descends; westerlies and polar easterlies meet toward subpolar lows. Cloud base is 14 °C and summit 8 °C. Wind names identify origin, so a northeast trade travels southwest.
High-school core: typically grades 9-10
- Convert storage depth to volume, complete the carbon ledger and calculate the river nitrogen load with units.
- Explain why a single elevated nitrate concentration does not establish the cause or magnitude of a new nutrient input.
- [wind-rain-shadow] Latitude, moving air and a mountain barrier: Calculate lee-side sea-level temperature and connect the parcel path to a possible rain shadow. Why might a west coast and an inland location at the same latitude have different climate?
Check after your attempt
- The water gain is 60000 m³; final atmospheric stock is 905 Gt C; river load is 86.4 kg N/day.
- You also need flow, timing, baseline and source information. The same concentration can accompany very different loads.
- [wind-rain-shadow] Latitude, moving air and a mountain barrier: Lee temperature is 28 °C. Condensation on ascent and dry warming on descent can favor a drier lee; coast/ocean currents, seasonal flow and mountain barriers change moisture and temperature independently of latitude.
Honors extension: typically grades 11-12
- Find worst-case lower and upper bounds on the water storage change. Can its sign be resolved?
- Compare the role of tectonics, solar heating and Earth’s rotation; propose a test distinguishing a changed water flux from a shifted system boundary.
- [wind-rain-shadow] Latitude, moving air and a mountain barrier: Identify why the fixed saturated lapse is a simplification and propose supplied-map evidence to test a rain-shadow interpretation without a field excursion.
Check after your attempt
- Lower bound: 950 − 640 − 270 − 140 = −100 mm/year; upper: 1050 − 560 − 230 − 100 = 160. The sign is unresolved within these bounds; they are not a confidence interval.
- Internal heat/gravity drive solid-Earth change, solar heating supplies external energy, and rotation deflects motion. Hold the boundary and time interval fixed, measure relevant inflows/outflows, and compare storage independently.
- [wind-rain-shadow] Latitude, moving air and a mountain barrier: Saturated cooling varies with moisture and temperature, and mixing can change the parcel. Compare elevation, seasonal wind direction and long-term precipitation records on both sides, controlling latitude and distance to the ocean; no risky mountain visit is needed.
History, reading, and writing connection
Compare the USGS water-cycle depiction of human withdrawals with the OpenStax account of industrial nitrogen fixation. Write how technology changes a flux without changing conservation of matter. Distinguish the historical innovation, the measurable benefit, and a possible downstream cost that requires evidence.
Write in your own words or use an approved accessible equivalent. Cite a specific assigned section or figure, identify its evidence, and state one limitation or counterargument. Use the AI practice contract only for permitted coaching, never to invent observations or write the assessed response.
Transfer to a new case
A second synthetic day has nitrate 4 mg N/L and flow 0.25 m³/s for 86400 seconds. Has daily nitrogen load doubled? [wind-rain-shadow] Latitude, moving air and a mountain barrier: In a new synthetic parcel, initial temperature is 24 °C, cloud base 0.5 km, summit 2 km, dry lapse 10 °C/km and saturated lapse 6 °C/km. Find the final lee sea-level temperature.
Calibration: No. The load remains 86.4 kg N/day because concentration doubled while flow halved. A concentration comparison alone gives the wrong load conclusion. [wind-rain-shadow] Latitude, moving air and a mountain barrier: The summit is 24 − 5 − 9 = 10 °C; dry descent adds 20 °C, giving 30 °C. Changed moisture conditions alter the result even at the same mountain height.
Evidence to retain
Retain system-boundary diagrams, complete conversion factors, budget bounds and source labels. Any approved field kit work needs its own supervised procedure, calibration, waste plan and dated record; these tables are not that work. [wind-rain-shadow] Latitude, moving air and a mountain barrier: Retain a hemispheric wind/pressure sketch, unit-bearing parcel ledger and a seasonal map-comparison plan. Use Unit 3 Earth-driver, boundary and inference criteria; no weather forecast or excursion completion is claimed.
Record units, calculations, source/date, uncertainty, and what is measured versus inferred. A simulation or supplied dataset must stay labeled as such. Use supplied data or an instructor-approved supervised observation. No electrical work, combustion, radioactive materials, pesticide application, wildlife capture, microbial culture, hazardous sampling or sample ingestion is authorized.
Return to all eight learning pathways. Print this unit page for the student lessons; the linked five-page packet remains the separate assessment companion.
Unit mastery rubric
| Criterion | Developing | Proficient | Mastery |
|---|---|---|---|
| Carbon reservoirs and transformations | Confuses carbon with energy. | Names major carbon pathways. | Traces photosynthesis, respiration, ocean exchange and combustion; completes a consistent carbon-stock ledger. |
| Nitrogen transformations | Treats N₂ as usable by all organisms. | Names fixation with prompting. | Distinguishes fixation, assimilation, ammonification, nitrification and denitrification, including industrial nitrogen inputs. |
| Phosphorus, water and Earth drivers | Confuses cycles and their drivers. | Describes individual pathways. | Connects tectonics, sunlight, gravity and wind/rain-shadow geography to cycles; distinguishes phosphorus dust transport from a gaseous reservoir. |
| System boundaries and budgets | Mixes stocks, flows or boundaries. | Balances a ledger with help. | Computes a storage change with compatible units, explicit boundaries and uncertainty bounds. |
| Cycle-flux measurement and inference | Treats concentration as a flux. | Reads a kit result with guidance. | Demonstrates approved measurement or data handling, combines concentration with flow, and limits source attribution to the evidence. |
| Integration (cross-domain) | Makes no supported connection between the source and the science. | Uses the source but needs help connecting evidence, writing, or limitations to the science. | Independently connects History, Reading, and Writing using a cited source, appropriate evidence, a limitation, and a scientific explanation. |
Integration is reported separately and cannot lower the science grade or block a science demonstration pass. Science and practical criteria determine that pass. Use the integration guide's evidence checklist for the separately reported criterion.
The river carries 86.4 kg N/day under constant-flow assumptions. A second day with twice the concentration and half the flow has the same load. Neither result alone identifies its source.
Nitrate doubled, so twice as much nitrogen entered and fertilizer must be responsible.
Assess the cycle model and dimensional calculation independently from an approved supervised measurement. A supplied dataset does not certify kit handling.
A 5-page clipboard packet — unit overview, key terms, the mastery rubric, anchor examples, and a score sheet you can print and grade against.