Unit 04 · Human Population & Resource Use
This unit explicitly includes energy resources and consumption within the existing eight-unit sequence: fuel pathways, nuclear and renewable technologies, power versus energy, efficiency, capacity factor, conservation and demand. Population and resource accounting remain part of the same system.
Student learning: Human demand and energy resources: from watts to tradeoffs
Choose the level by readiness, not age alone, and record it before instruction. Foundation, core, and honors tasks are study pathways, not an AP course or a promise of college credit. The instructor retains practical assessment and the published science rubric; integration is reported separately.
Prerequisites: Unit 3 budgets; percentages, scientific notation, multiplication by time, and optional logarithms for exact doubling time.
Suggested sequence: read and discuss the explanation; attempt the worked model; analyze the data at your selected level; check the answers; then complete the source-linked response and a fresh transfer question. These activities supplement, not replace, supervised practical work and the full-year schedule.
Assigned reading and focus
- EIA Energy Explained: Measuring Electricity. Read Electricity is measured in Watts and kilowatts and Electricity use over time is measured in Watthours. Rework the 40-W lamp example before the audit.
- EIA Energy Explained: Sources of Energy. Read Energy sources, Nonrenewable energy and Renewable energy. Separate primary fuels from electricity and hydrogen as energy carriers, and note the historical shift from biomass to fossil fuels.
- EIA Energy Explained: Renewable Energy Types and Usage. Read the five-type overview, including biomass/biofuels, geothermal, conventional versus pumped-storage hydropower, solar PV versus thermal, and wind. Describe each conversion mechanism, not just a label.
- EIA Energy Explained: Nuclear Power and the Environment. Read Nuclear power reactors do not produce carbon dioxide emissions and Nuclear energy produces radioactive waste. Distinguish operation from construction/fuel-cycle emissions and distinguish waste volume from radioactivity.
- OpenStax Biology 2e, 45.5: Human Population Growth. Read the age-structure discussion and Overcoming Density-Dependent Regulation. Treat its dated world-population narrative as historical textbook context, not a current census or an inevitable forecast for every country.
- OpenStax Biology 2e: 45.5 Human Population Growth. [demographic-standardization] Age composition can change crude rates without changing age-specific risk: Read age structure and demographic change; distinguish an age composition from a fertility schedule or inevitable transition.
- OpenStax Biology 2e: 45.1 Population Demography. [demographic-standardization] Age composition can change crude rates without changing age-specific risk: Review age-specific survival and denominator choice before comparing a whole-population rate.
- EIA Washington Electricity Profile 2024, Table 1: Summary statistics. [regional-energy] A dated geographic comparison is not a global energy balance: Read Table 1, year 2024, especially primary energy source, net generation and retail sales. Keep Washington’s geographic and reporting boundary visible.
- EIA Arizona Electricity Profile 2024, Table 1: Summary statistics. [regional-energy] A dated geographic comparison is not a global energy balance: Read the matching Table 1 and compare the same year and definitions. Distinguish generation in Arizona from the energy ultimately consumed by its residents.
- IPCC AR6 Working Group III, Chapter 6: Energy Systems. [fuel-lifecycle] Equal electricity, fuel mass and lifecycle boundaries: Read the electricity-generation and lifecycle-emissions discussion, including uncertainty and differences among energy systems. Distinguish operational emissions, upstream fuels and construction rather than treating one boundary as the whole lifecycle.
- EIA Energy Explained: Energy Storage for Electricity Generation. [storage-dispatch] Equal energy totals can still leave an evening shortfall: Read how storage shifts electricity in time, its power and energy ratings, and charging/discharging losses. Distinguish a storage device from a primary energy source.
Learn the science
Power is an energy-transfer rate. A watt is a joule/second; 1000 W = 1 kW and 1 kWh = 3.6 MJ. Electrical energy = power × operating time. A 1500-W model heater used for two hours consumes 3 kWh, not 3 kW. Nameplate power may differ from average cycling power; this exercise specifies constant power.
Primary energy sources include fossil fuels, uranium, sunlight, flowing water and wind. Electricity and hydrogen are carriers made using primary energy. Coal, petroleum and natural gas are nonrenewable on human timescales; their combustion releases CO₂ and other emissions depending on fuel and controls. Fossil deposits, transmission, cost and access are geographically uneven, so national totals and per-person demand answer different questions.
Nuclear fission releases heat from splitting nuclei, commonly followed by steam generation and a turbine. It is not combustion or fusion. Low direct operating CO₂ does not mean zero life-cycle impact: mining, enrichment, construction, cooling needs and radioactive-waste management must be considered. No reactor or radioactive-material experiment belongs in this course.
Solar PV converts light to electricity; solar thermal uses heat. Wind turbines and hydroelectric turbines use motion; dams can change flow and habitat. Geothermal systems use Earth’s heat, but suitable resources are location-dependent. Biomass and ethanol can be replenished only under explicit regrowth and land-use assumptions; burning biomass still emits CO₂ and can add air pollutants. Hydrogen fuel cells convert a fuel’s chemical energy to electricity, but hydrogen production, storage and losses belong in the system boundary.
Energy conservation reduces the service demanded, while efficiency uses less input for a specified service. Neither label alone quantifies savings. A thermal plant with 100 MJ input and 35 MJ electricity is 35% efficient; the other 65 MJ is heat and other losses, not destroyed energy. Compare plants on the same useful output, not just on fuel mass.
Annual generation = rated capacity × 8760 hours/year × capacity factor. Capacity factor is actual energy divided by full-output possible energy, not conversion efficiency. An annual solar output estimate is not firm capacity available at night or during a peak demand hour; matching reliability requires time-resolved demand, storage, transmission or other supply information.
Population changes by births − deaths + net migration. The demographic-transition model describes common historical rate patterns, not a law forcing each nation through a fixed sequence. A wide younger age group can produce demographic momentum, but future fertility, mortality and migration are also needed for a forecast. The rule of 70 is an approximation for a positive roughly constant percentage growth rate.
For an explicitly defined impact, I = P × A × T can be a bookkeeping model: people × service/person × impact/service. It is not a universal causal equation. Our electricity-use metric is not a full ecological footprint, which also needs land/productivity equivalence, consumption categories, trade and biocapacity assumptions. Do not rename kWh or kilograms CO₂ as global hectares.
[demographic-standardization] Age composition can change crude rates without changing age-specific risk: Crude death rate divides all deaths by the same-year midyear population, so its value depends on age composition. Direct standardization applies both populations’ age-specific rates to one explicit reference distribution. This isolates the arithmetic effect of composition, not every social or biological difference. Period total fertility rate (TFR) sums age-specific births per woman across reproductive ages under that year’s rates; it is not completed cohort fertility or a forecast.
[demographic-standardization] Age composition can change crude rates without changing age-specific risk: Model and provenance assumptions: Two fictional populations each have 10000 midyear residents; deaths occur during one model year. Standard age weights are 0.8 and 0.2. Fertility rates use births per 1000 women in each five-year age band per year, with complete bands 15–49.
[demographic-standardization] Age composition can change crude rates without changing age-specific risk: Uncertainty and inference limits: Broad age bands can still hide within-band differences, migration and reporting gaps. The chosen standard changes the standardized number. TFR assumes the entire age schedule persists for a hypothetical cohort and does not imply that actual people will follow it.
[regional-energy] A dated geographic comparison is not a global energy balance: Resource geography and energy infrastructure influence supply: Washington’s reported leading electricity source is hydroelectricity, while Arizona’s is natural gas. Hydropower depends on watershed inflow, storage and environmental flow constraints; sunny geography does not make solar the leading source automatically. Electricity generated inside a state is not the same as retail sales inside it. Interstate trade, direct use, losses and reporting boundaries prevent treating their difference as exact net exports. These observations concern electricity, not all primary energy or all countries.
[regional-energy] A dated geographic comparison is not a global energy balance: Model and provenance assumptions: The first table transcribes the public EIA 2024 State Electricity Profiles, Table 1, retrieved 2026-09-28 UTC. These are published historical observations, not 2026 readings. The second, separate ledger is synthetic annual regional electricity with a complete generation/import/export/loss boundary and four million residents.
[regional-energy] A dated geographic comparison is not a global energy balance: Uncertainty and inference limits: EIA can revise historical statistics and definitions; retrieval date is not measurement year. Two U.S. states do not represent global resource distribution, fuel reserves or every end use. The synthetic regional population and loss values are not EIA observations and must never be attached to the state rows.
[fuel-lifecycle] Equal electricity, fuel mass and lifecycle boundaries: Compare fuels per equal useful electrical output, not per kilogram of fuel. One kWh is 3.6 MJ; fuel input = 3.6/efficiency and fuel mass = input/heat content on the same heating-value basis. Stack CO₂ is only one term. Upstream fuel extraction, methane leakage, materials, construction and decommissioning can contribute; CO₂-equivalent requires a chosen time horizon. Low operating emissions for wind or nuclear do not make all lifecycle stages zero.
[fuel-lifecycle] Equal electricity, fuel mass and lifecycle boundaries: Model and provenance assumptions: Synthetic fuel inputs all use lower-heating-value energy and net plant-bus electricity. Upstream and construction factors are already expressed as 100-year CO₂e per kWh and must not be multiplied by fuel input again. The separate wind asset allocates embodied emissions across stipulated lifetime output; transmission/storage are outside both comparisons.
[fuel-lifecycle] Equal electricity, fuel mass and lifecycle boundaries: Uncertainty and inference limits: Plant efficiency, fuel quality, methane conversion factors, lifetime output and system boundary vary. The model is not an IPCC emissions dataset. Gas upstream emissions above 586.8 g CO₂e/kWh would reverse its central comparison with the specified coal model; that is an arithmetic threshold, not an estimate of real leakage.
[storage-dispatch] Equal energy totals can still leave an evening shortfall: A storage energy rating (kWh) limits stored quantity, while charge/discharge power ratings (kW) limit flow each interval. Serve simultaneous demand directly; charge from surplus subject to input power and remaining capacity, then use stored energy during deficits subject to output power and discharge efficiency. State of charge must carry forward. Annual energy equality is not sufficient reliability evidence: the timing of supply, losses, power limits and initial energy matter.
[storage-dispatch] Equal energy totals can still leave an evening shortfall: Model and provenance assumptions: Four synthetic one-hour intervals share one AC delivery bus. Storage starts empty; capacity is 3.2 kWh stored energy. Charge limit is 4 kW input and discharge limit 2 kW output; each efficiency is 0.8, so round-trip efficiency is 0.64. No self-discharge, reserve or import supply is modeled.
[storage-dispatch] Equal energy totals can still leave an evening shortfall: Uncertainty and inference limits: The four-hour example is not an annual reliability assessment. Weather sequences, equipment failure, degradation and reserves would need longer chronological records. Increasing renewable energy without enough charging power or capacity can cause curtailment rather than remove the shortfall.

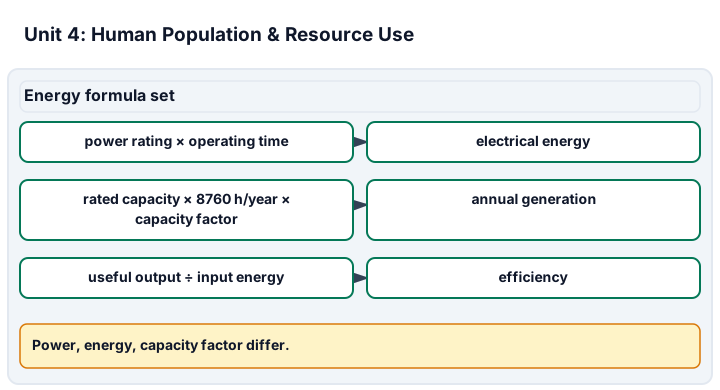
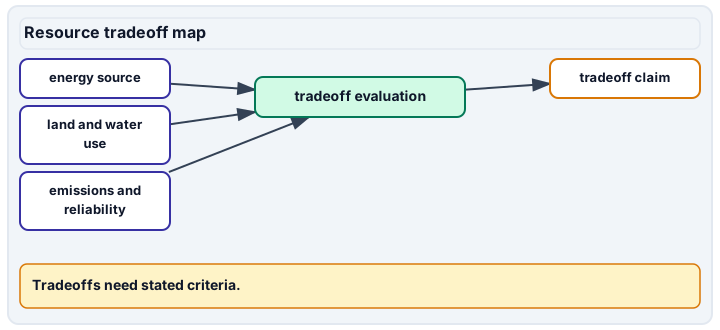
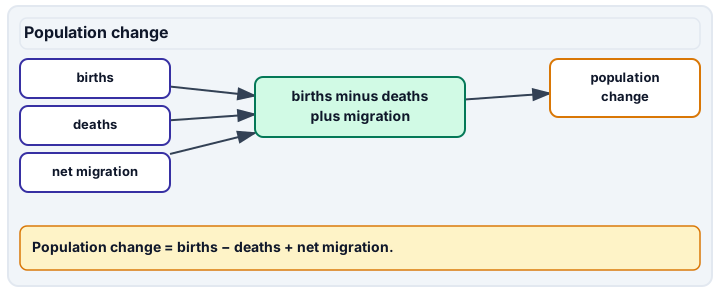
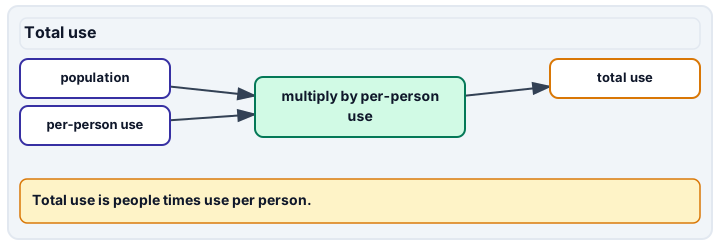
Diagram description
The energy formula panel separates power, energy, capacity factor and efficiency; annual generation is rated capacity × 8760 hours per year × capacity factor. The resource tradeoff panel maps an energy source through land use, water use, emissions and reliability before any claim. Population change uses births, deaths and net migration; total use uses population and per-person use.
Data, provenance, and assumptions
| Device model | Power (W) | Hours/day | Device count |
|---|---|---|---|
| LED lighting | 10 | 5 | 10 |
| Laptop | 60 | 4 | 1 |
| Heating model | 1500 | 2 | 1 |
| Old power (W) | New power (W) | Hours/day | Count | Extra total cost ($) |
|---|---|---|---|---|
| 60 | 10 | 5 | 10 | 50 |
| Source | Capacity (kW) | Capacity factor (fraction) |
|---|---|---|
| Solar PV | 10 | 0.18 |
| Wind | 10 | 0.3 |
| Gas turbine | 10 | 0.6 |
| Nuclear | 10 | 0.9 |
| Input (MJ) | Electric output (MJ) | Heat/other losses (MJ) |
|---|---|---|
| 100 | 35 | 65 |
| Community | Population | Birth rate | Death rate | Net migration rate | Electricity (kWh/day) |
|---|---|---|---|---|---|
| A | 100000 | 20 | 8 | 0 | 2000000 |
| B | 50000 | 12 | 12 | 0 | 1500000 |
| Community | Under 15 (people) | 15–64 (people) | 65+ (people) |
|---|---|---|---|
| A | 30000 | 65000 | 5000 |
| B | 7500 | 35000 | 7500 |
| Power (W) | Hours/day | Count | Days | Price ($/kWh) |
|---|---|---|---|---|
| 800 | 1.5 | 1 | 30 | 0.25 |
| Age band | A residents | A deaths/year | B residents | B deaths/year | Standard population fraction |
|---|---|---|---|---|---|
| 0–64 years | 9000 | 18 | 5000 | 10 | 0.8 |
| 65+ years | 1000 | 40 | 5000 | 200 | 0.2 |
| Maternal age band | Band width (years) | Births/1000 women/year |
|---|---|---|
| 15–19 | 5 | 20 |
| 20–24 | 5 | 80 |
| 25–29 | 5 | 100 |
| 30–34 | 5 | 100 |
| 35–39 | 5 | 70 |
| 40–44 | 5 | 25 |
| 45–49 | 5 | 5 |
| State / reporting year | Reported primary electricity source | Net generation (MWh/year) | Retail sales (MWh/year) |
|---|---|---|---|
| Washington / 2024 | Hydroelectric | 102397711 | 89981629 |
| Arizona / 2024 | Natural gas | 116026511 | 90843288 |
| Generation (GWh/year) | Imports (GWh/year) | Exports (GWh/year) | Losses (GWh/year) | Residents |
|---|---|---|---|---|
| 50000 | 5000 | 10000 | 3000 | 4000000 |
| Fuel | LHV (MJ/kg fuel) | Net efficiency (fraction) | Stack factor (g CO₂/MJ fuel) | Upstream (g CO₂e/kWh) | Construction/end-of-life (g CO₂e/kWh) |
|---|---|---|---|---|---|
| Coal model | 24 | 0.36 | 94 | 50 | 10 |
| Gas model | 50 | 0.5 | 56 | 80 | 10 |
| Asset | Embodied burden (tonnes CO₂e) | Lifetime output (kWh) | Maintenance (g CO₂e/kWh) |
|---|---|---|---|
| Wind model | 500 | 10000000 | 5 |
| Interval | Duration (hours) | Demand (kW) | Renewable generation (kW) |
|---|---|---|---|
| 1 | 1 | 2 | 6 |
| 2 | 1 | 2 | 2 |
| 3 | 1 | 2 | 0 |
| 4 | 1 | 2 | 0 |
| Stored-energy capacity (kWh) | Charge input limit (kW) | Discharge output limit (kW) | Charge efficiency (fraction) | Discharge efficiency (fraction) |
|---|---|---|---|---|
| 3.2 | 4 | 2 | 0.8 | 0.8 |
Worked model
Daily audit energy = (10/1000 × 5 × 10) + (60/1000 × 4) + (1500/1000 × 2) = 3.74 kWh. Annual energy is 1365.1 kWh and cost $273.02. Lighting saves 2.5 kWh/day or 912.5 kWh/year; simple payback is $50/($0.50/day) = 100 days. Solar generation = 10 × 8760 × 0.18 = 15768 kWh/year. [demographic-standardization] Age composition can change crude rates without changing age-specific risk: A crude mortality = 58/10000 × 1000 = 5.8 deaths/1000 residents/year; B = 210/10000 × 1000 = 21. Both have age-specific rates 2 and 40 per 1000/year. Standardized rate = 0.8×2 + 0.2×40 = 9.6 for both. TFR = 5×(20+80+100+100+70+25+5)/1000 = 2 births/woman. [regional-energy] A dated geographic comparison is not a global energy balance: Published generation minus retail sales is 12416082 MWh in Washington and 25183223 MWh in Arizona for 2024; neither difference alone is a net-export measurement. In the separate complete model, delivery = 50000 + 5000 − 10000 − 3000 = 42000 GWh/year, or 10500 kWh/resident/year. [fuel-lifecycle] Equal electricity, fuel mass and lifecycle boundaries: Coal needs 10 MJ fuel/kWh, 0.416667 kg fuel/kWh and rejects 6.4 MJ/kWh. Gas needs 7.2 MJ, 0.144 kg and rejects 3.6 MJ. Lifecycle totals: coal 10×94+50+10 = 1000; gas 7.2×56+80+10 = 493.2 g CO₂e/kWh. Wind allocation is 500×10⁶/10⁷ + 5 = 55 g CO₂e/kWh, not zero. [storage-dispatch] Equal energy totals can still leave an evening shortfall: Interval 1 serves 2 kWh directly and charges 4 kWh input, storing 3.2. Interval 2 serves 2 directly. Interval 3 delivers 2 from storage, consuming 2.5 and leaving 0.7. Interval 4 can deliver only 0.56, leaving 1.44 kWh unserved. Final storage is zero; 8 generated = 6.56 served + 1.44 losses, with no curtailment.
Numerical calibration
- 3.74 kWh/day
- 1365.1 kWh/year
- 273.02 $/year
- 912.5 kWh/year
- 100 days
- 15768 kWh/year
- 35 %
- 10.285714 MJ input/kWh electricity
- 12.5 %
- 101200 people
- 1.2 %/year
- 20 kWh/person/day
- 30 kWh/person/day
- -7.6 %
- 36 kWh in 30 days
- 9 $ for 30 days
- 5.8 deaths/1000 residents/year
- 21 deaths/1000 residents/year
- 9.6 deaths/1000 standard residents/year
- 2 births/woman under period schedule
- 5.8 deaths/1000 standard residents/year
- 12416082 MWh in 2024, not net exports
- 25183223 MWh in 2024, not net exports
- 42000 GWh/year synthetic delivery
- 10500 kWh/resident/year synthetic delivery
- 10250 kWh/resident/year at 4000 GWh losses
- 10750 kWh/resident/year at 2000 GWh losses
- 8400 kWh/resident/year synthetic delivery
- 0.4166666667 kg fuel/kWh net electricity
- 6.4 MJ/kWh net electricity
- 1000 g CO₂e/kWh, 100-year basis
- 0.144 kg fuel/kWh net electricity
- 3.6 MJ/kWh net electricity
- 493.2 g CO₂e/kWh, 100-year basis
- 55 g CO₂e/kWh, allocated lifetime basis
- 105 g CO₂e/kWh with halved lifetime output
- 586.8 g upstream CO₂e/kWh at coal/gas equality
- 913.2 g CO₂e/kWh, 100-year basis
- 1.44 kWh unserved over four hours
- 1.44 kWh storage losses over four hours
- 0 kWh stored at final boundary
- 0.8 kWh unserved over fresh four-hour schedule
Attempt the assigned level
Try the tasks before reading the calibration. These are practice answers, not a secure examination; use a new dataset or changed assumption for the assessed transfer.
Foundation
- Compute the daily energy for each audit row and the total; distinguish kW, kWh and MJ.
- Classify fossil fuels, uranium, solar, wind, geothermal and biomass, then explain why electricity is not inherently renewable.
- Find the under-15 share for A and B. State what would be needed before using those shares to predict growth.
- [demographic-standardization] Age composition can change crude rates without changing age-specific risk: Calculate both crude death rates and both age-specific rates. Can the higher crude value alone establish worse age-specific survival?
- [regional-energy] A dated geographic comparison is not a global energy balance: Record each state, reporting year, dataset identity, units and leading source. Calculate generation minus retail sales, without renaming the difference net exports.
- [fuel-lifecycle] Equal electricity, fuel mass and lifecycle boundaries: Calculate fuel energy, fuel mass and rejected heat for both thermal models at 1 kWh output. Show that useful output plus rejected heat equals input.
- [storage-dispatch] Equal energy totals can still leave an evening shortfall: Write a four-row ledger with direct service, charge input, stored energy at interval end and unserved energy. Do not reset storage to full at each interval.
Check after your attempt
- Lighting 0.50, laptop 0.24 and heating 3.00 kWh/day total 3.74. Power is a rate; kWh and MJ are energy.
- Fossil fuels and uranium are nonrenewable. Renewable flows have location/time limits; biomass requires regrowth accounting. Electricity’s impacts depend on its production chain.
- A has 30% under 15 and B 15%. Fertility, mortality, migration and time-specific rates remain necessary; the shapes alone do not force a forecast.
- [demographic-standardization] Age composition can change crude rates without changing age-specific risk: Crude rates are 5.8 and 21 deaths/1000 residents/year, but the age-specific rates match at 2 and 40. The different age composition explains this constructed contrast; it is not a survival-quality ranking.
- [regional-energy] A dated geographic comparison is not a global energy balance: Washington and Arizona are both 2024 EIA Table 1 records, led by hydroelectricity and natural gas. Their differences are 12416082 and 25183223 MWh. Losses, direct use, imports and reporting boundaries are missing from that subtraction.
- [fuel-lifecycle] Equal electricity, fuel mass and lifecycle boundaries: Coal: 10 MJ, 0.416667 kg and 6.4 MJ rejected; gas: 7.2 MJ, 0.144 kg and 3.6 MJ rejected. Adding 3.6 MJ useful output closes each balance. Lower mass alone does not establish lower total impact.
- [storage-dispatch] Equal energy totals can still leave an evening shortfall: End states are 3.2, 3.2, 0.7 and 0 kWh. Direct service is 2, 2, 0 and 0 kWh; charge input 4, 0, 0 and 0. Unserved energy appears only in interval 4 and equals 1.44 kWh.
High-school core: typically grades 9-10
- Compute annual audit cost and lighting payback. Calculate the plant efficiency and fuel energy per 1 kWh electricity.
- Compare solar and gas annual generation for the same nameplate capacity; explain why output totals do not establish reliability.
- Compute next-year A population and each community’s per-person daily electricity. Compare total use with per-capita use.
- [demographic-standardization] Age composition can change crude rates without changing age-specific risk: Apply the shared 0.8/0.2 age weights and compute period TFR across all seven bands. Keep the rate and fertility denominators separate.
- [regional-energy] A dated geographic comparison is not a global energy balance: Balance the separate synthetic regional ledger and convert annual delivery to kWh per resident. Explain which geographic resource constraint should be examined for hydroelectric supply.
- [fuel-lifecycle] Equal electricity, fuel mass and lifecycle boundaries: Sum stack, upstream and construction terms and compute the wind asset’s lifetime allocation. Which terms already have a per-kWh denominator?
- [storage-dispatch] Equal energy totals can still leave an evening shortfall: Close the energy balance and explain why an eight-kWh supply total does not meet an eight-kWh demand total. Distinguish the two power limits from stored-energy capacity.
Check after your attempt
- Annual cost is $273.02 and simple payback 100 days. Thermal efficiency is 35%; input per kWh is 3.6/0.35 ≈ 10.286 MJ.
- Solar gives 15768 and gas 52560 kWh/year under the invented factors. Annual averages do not establish when generation matches demand.
- A grows 1.2% to 101200 if rates hold; B stays 50000. A uses 20 and B 30 kWh/person/day. A has the larger total; B the larger per-person use.
- [demographic-standardization] Age composition can change crude rates without changing age-specific risk: Both standardized rates are 9.6 deaths/1000/year. The period TFR is 2 births/woman under the synthetic age schedule; it is not a one-year birth rate of two per woman.
- [regional-energy] A dated geographic comparison is not a global energy balance: Delivery is 42000 GWh/year and 10500 kWh/resident/year. Hydrologic inflow, drought, reservoir operation and ecological flow constraints matter; a capacity or annual generation statistic cannot prove delivery during a dry peak period.
- [fuel-lifecycle] Equal electricity, fuel mass and lifecycle boundaries: Totals are 1000, 493.2 and 55 g CO₂e/kWh for the coal, gas and separate wind models. Upstream, construction and maintenance factors are already normalized per kWh; multiplying those by fuel input would miscount.
- [storage-dispatch] Equal energy totals can still leave an evening shortfall: Served demand is 6.56 kWh and storage loss 1.44; their sum is eight. Charge input cannot exceed 4 kWh in one hour and discharge output cannot exceed 2; stored energy cannot exceed 3.2. Equal totals ignore losses and timing.
Honors extension: typically grades 11-12
- At equal electrical output, calculate fuel savings from raising efficiency from 35% to 40%. Explain what is outside this comparison.
- For one specified impact, model population ×1.10, service/person ×1.20, and impact/service ×0.70. Compute total impact change.
- Calculate A’s approximate doubling time and compare with ln(2)/ln(1.012). Identify two limits of extrapolating the rates.
- [demographic-standardization] Age composition can change crude rates without changing age-specific risk: Explain which migration, fertility and age-detail evidence would be needed before predicting population size ten years later from these summaries.
- [regional-energy] A dated geographic comparison is not a global energy balance: If modeled annual losses range 2000–4000 GWh, bound per-person delivery. Specify what dated data would extend the two-state comparison to global primary energy rather than exaggerating this table’s scope.
- [fuel-lifecycle] Equal electricity, fuel mass and lifecycle boundaries: Halve wind lifetime output while retaining embodied burden, and solve the gas upstream factor that ties the coal total. Identify two non-climate outcomes still missing.
- [storage-dispatch] Equal energy totals can still leave an evening shortfall: Keep the original battery but raise interval-one generation to 8 kW. Calculate curtailment and the evening shortfall. Name data required for an actual reliability claim.
Check after your attempt
- Input falls from output/0.35 to output/0.40: a 12.5% fuel-energy saving, not 5%. Fuel supply, construction, costs and emissions factors were not supplied.
- Impact becomes 1.10 × 1.20 × 0.70 = 0.924 of baseline, a 7.6% decrease. This is a conditional bookkeeping result, not evidence that a particular policy caused it.
- Rule of 70 gives about 58.3 years; the discrete-growth expression gives about 58.1 years. Changing fertility, mortality or migration can invalidate either constant-rate forecast.
- [demographic-standardization] Age composition can change crude rates without changing age-specific risk: Need age-specific births, survival and net migration over time, with finer age groups and uncertainty. One-year crude rates and a period TFR do not establish an inevitable demographic-transition stage or a ten-year forecast.
- [regional-energy] A dated geographic comparison is not a global energy balance: Delivery spans 41000–43000 GWh, or 10250–10750 kWh/resident/year. A global comparison needs harmonized country/year primary-energy balances, population, fuel/trade definitions and uncertainty; this state electricity table cannot substitute for them.
- [fuel-lifecycle] Equal electricity, fuel mass and lifecycle boundaries: Wind becomes 105 g CO₂e/kWh. Gas ties coal when upstream = 1000 − 403.2 − 10 = 586.8 g CO₂e/kWh. Water use, air toxics, mining damage, waste and habitat effects need their own evidence; carbon is not a complete ranking.
- [storage-dispatch] Equal energy totals can still leave an evening shortfall: Surplus is 6 kWh but only 4 can charge, so 2 is curtailed. Evening unserved energy stays 1.44 kWh. A long chronological load/weather record, outage assumptions, reserves and degradation are required; annual capacity factor alone is not enough.
History, reading, and writing connection
Use EIA’s history of the shift from biomass to fossil energy and its nuclear environmental discussion. Write a comparison of two energy systems serving the same need. Distinguish historical evidence, conversion physics, a measurable environmental burden, and a value judgment about acceptable tradeoffs. No technology or political recommendation is required.
Write in your own words or use an approved accessible equivalent. Cite a specific assigned section or figure, identify its evidence, and state one limitation or counterargument. Use the AI practice contract only for permitted coaching, never to invent observations or write the assessed response.
Transfer to a new case
Use the fresh energy-transfer row: an 800-W device operates 1.5 hours daily for 30 days at $0.25/kWh. Find energy and cost. Would a matching annual solar total prove it can operate whenever wanted? [demographic-standardization] Age composition can change crude rates without changing age-specific risk: A revised standard uses age weights 0.9 and 0.1 while both age-specific death rates stay 2 and 40 per 1000/year. Find the new standardized rate and say whether anyone’s underlying rate changed. [regional-energy] A dated geographic comparison is not a global energy balance: A fresh synthetic region has generation 50 TWh, imports 5 TWh, exports 10 TWh, losses 3 TWh in one year and five million residents. Find delivered kWh/resident/year; use 1 TWh = 10⁹ kWh. [fuel-lifecycle] Equal electricity, fuel mass and lifecycle boundaries: A fresh gas supply-chain scenario has upstream 500 g CO₂e/kWh, stack factor 56 g CO₂/MJ, efficiency 0.50 and construction 10 g CO₂e/kWh. Find its lifecycle total on the same 100-year basis. [storage-dispatch] Equal energy totals can still leave an evening shortfall: A fresh four-hour schedule has generation 7, 3, 0, 0 kW and demand 2 kW each hour. Storage starts empty with capacity 4 kWh, charge/discharge limits 4/2 kW and efficiencies 0.8/0.8. Find total unserved energy.
Calibration: Energy is 36 kWh and the energy charge $9. No: coincident generation, demand, storage and backup conditions are unknown. [demographic-standardization] Age composition can change crude rates without changing age-specific risk: The revised rate is 0.9×2 + 0.1×40 = 5.8 deaths/1000/year for both. Only the reference composition changed, not either age-specific rate. [regional-energy] A dated geographic comparison is not a global energy balance: Delivery is 42 TWh/year. Dividing 42×10⁹ kWh by five million residents gives 8400 kWh/resident/year, not 8.4 or 8400000; this is a new model, not an updated EIA observation. [fuel-lifecycle] Equal electricity, fuel mass and lifecycle boundaries: The total is (3.6/0.5)×56 + 500 + 10 = 913.2 g CO₂e/kWh. It is higher than the original gas model but still below this coal model; real supply-chain values need dated evidence. [storage-dispatch] Equal energy totals can still leave an evening shortfall: Store 3.2 then 4 kWh, curtailing 1 kWh in hour one. Deliver 2 then 1.2 kWh from storage; unserved energy is 0.8 kWh. Generated 10 = served 7.2 + loss 1.8 + curtailment 1, with zero final storage.
Evidence to retain
Retain unit conversions, all energy/demographic denominators, a source-based technology comparison and uncertainty assumptions. Use supplied schedules or an adult-provided redacted record; do not collect identifiable household bills or perform electrical experiments. [demographic-standardization] Age composition can change crude rates without changing age-specific risk: Keep crude and standardized rate work, explicit standard weights, the full fertility-band sum and forecast limits. Use Unit 4 demographic/demand reasoning and data-defense criteria, not unsupported claims about real populations. [regional-energy] A dated geographic comparison is not a global energy balance: Keep source URLs, EIA dataset/year/units, geographic resource comparison, an observation-versus-model label and a closed delivery ledger. Use Unit 4 demand, source, energy and audit criteria; no claim of current global energy coverage is made. [fuel-lifecycle] Equal electricity, fuel mass and lifecycle boundaries: Retain equal-output fuel and heat balances, a stage-by-stage lifecycle sum, time horizon and lifetime-output sensitivity. Use Unit 4 demand, resources, efficiency and audit criteria without claiming actual fuel sampling or a complete environmental ranking. [storage-dispatch] Equal energy totals can still leave an evening shortfall: Retain the chronological state-of-charge ledger, both power limits, round-trip efficiency, conservation check and fresh dispatch. Use Unit 4 demand/resource/energy/audit criteria; this is not electrical-work authorization or a year-long reliability certification.
Record units, calculations, source/date, uncertainty, and what is measured versus inferred. A simulation or supplied dataset must stay labeled as such. Use supplied data or an instructor-approved supervised observation. No electrical work, combustion, radioactive materials, pesticide application, wildlife capture, microbial culture, hazardous sampling or sample ingestion is authorized.
Return to all eight learning pathways. Print this unit page for the student lessons; the linked five-page packet remains the separate assessment companion.
Unit mastery rubric
| Criterion | Developing | Proficient | Mastery |
|---|---|---|---|
| Demography, age structure and growth | Treats a pyramid as destiny. | Reads rates or ages with help. | Calculates growth/doubling, standardized mortality and period fertility; interprets age and migration conditionally. |
| IPAT and resource accounting | Blames impact on population alone. | Names factors without denominators. | Calculates total and per-capita use and an IPAT scenario; distinguishes the metric from a full ecological footprint. |
| Energy resources and conversion | Confuses fuels and carriers. | Lists sources without mechanisms. | Explains fossil/nuclear/renewable pathways and geography; compares fuels and lifecycles on equal useful output. |
| Energy, efficiency and capacity factor | Confuses power and energy. | Uses formulas with prompting. | Calculates energy, cost, efficiency, generation and storage dispatch; separates capacity factor from firm capacity. |
| Audit and model defense | Omits units or invents readings. | Completes an audit with reminders. | Defends safe audits/models, conservation and uncertainty; labels observations versus synthetic data and tests transfer. |
| Integration (cross-domain) | Makes no supported connection between the source and the science. | Uses the source but needs help connecting evidence, writing, or limitations to the science. | Independently connects History, Reading, and Writing using a cited source, appropriate evidence, a limitation, and a scientific explanation. |
Integration is reported separately and cannot lower the science grade or block a science demonstration pass. Science and practical criteria determine that pass. Use the integration guide's evidence checklist for the separately reported criterion.
The audit uses 3.74 kWh/day, not kW. Lighting saves 912.5 kWh/year with a 100-day simple payback. A solar annual total does not prove nighttime supply, and kWh is not an ecological footprint.
A ten-kilowatt solar array produces ten kilowatt-hours each day, so it can replace any ten-kilowatt supply.
Demonstrate the audit/model and defend units, provenance and boundaries aloud. Supplied-data success is not electrical-work authorization, a full ecological-footprint assessment or a practical pass by itself.
A 5-page clipboard packet — unit overview, key terms, the mastery rubric, anchor examples, and a score sheet you can print and grade against.