Unit 05 · Water Resources & Pollution
Measure water conditions and mass loads while separating ecological indicators, chemical hazard, exposure and health-risk characterization. No classroom water-quality reading or synthetic screening quotient certifies safe drinking water.
Student learning: Pollution, exposure, and health risk are different questions
Choose the level by readiness, not age alone, and record it before instruction. Foundation, core, and honors tasks are study pathways, not an AP course or a promise of college credit. The instructor retains practical assessment and the published science rubric; integration is reported separately.
Prerequisites: Unit 3 concentration-to-load conversions; Unit 4 system boundaries; ratios and mass normalized by body mass and time.
Suggested sequence: read and discuss the explanation; attempt the worked model; analyze the data at your selected level; check the answers; then complete the source-linked response and a fresh transfer question. These activities supplement, not replace, supervised practical work and the full-year schedule.
Assigned reading and focus
- EPA: Basic Information on Nutrient Pollution. Read What is Nutrient Pollution? and the paragraphs on blooms, oxygen and groundwater. Separate nutrient enrichment, oxygen depletion, pathogens and toxins; not every bloom has the same hazards.
- EPA: Conducting a Human Health Risk Assessment. Read Planning and Scoping and the introductions to Step 1 Hazard Identification, Step 2 Dose-Response Assessment, Step 3 Exposure Assessment and Step 4 Risk Characterization. Identify route, amount, frequency, duration and population assumptions.
- CDC: How Water Treatment Works. Read Water treatment steps, from coagulation through disinfection. Explain why removing suspended particles is not the same as removing every dissolved chemical or killing every pathogen.
- EPA: DDT — A Brief History and Status. Read Regulation Due to Health and Environmental Effects. Distinguish persistence and fat accumulation from evidence of a particular population or human-health effect.
- EPA CADDIS: Temperature. [thermal-plume] A heat balance does not measure a safe river: Read how temperature affects water properties and aquatic life. Distinguish oxygen solubility from actual dissolved oxygen, which also depends on biological demand and mixing.
- CDC archived Principles of Epidemiology, Lesson 3: Measures of Association. [outbreak-cohort] Fictional disease surveillance: association, denominators and bias: Read risk ratio and the cohort-table denominator. This archived methods reference explains association measures, not current clinical or outbreak-management advice.
- EPA: Basic Information about Lead in Drinking Water. [lead-chloride] Pollutant form determines what a filter can remove: Read lead entry from plumbing/corrosion and the distinction between source-water treatment and household tap exposure. Do not infer safety from clear appearance.
- EPA CADDIS: Ionic Strength. [lead-chloride] Pollutant form determines what a filter can remove: Read sources and biological pathways for altered ionic strength. Distinguish dissolved salts from suspended particles and from pathogens.
Learn the science
A watershed drains to an outlet; groundwater moves through connected pores and fractures, not an unlimited underground lake. Withdrawal can exceed recharge, lower storage and alter stream flow. Human demand competes with ecosystem flow needs; a water budget needs a boundary, return flows and a time interval.
A point discharge has an identifiable outlet; nonpoint inputs are distributed, for example storm runoff from multiple fields. Concentration is mass per volume; load is mass per time. Increased downstream load can reflect tributaries, runoff, wastewater or changing storage. The table alone does not identify the source or show a before/after causal effect.
Excess nutrients can stimulate production, followed by decomposition and oxygen demand. Dissolved oxygen also varies with temperature, mixing, flow and time of day. BOD is an operational oxygen-demand measurement, not a synonym for low dissolved oxygen. Low oxygen affects aquatic organisms but is not a test of drinking-water safety.
Hazard identification asks whether an agent can cause harm; dose-response asks how effects vary with dose; exposure assessment asks who contacts it, by which route, how much and for how long. Risk characterization combines these with uncertainty. A pollutant measurement without exposure and toxicity information is not a human-health risk estimate.
For the fictional ingestion scenarios, potential daily intake per body mass = concentration × ingested water volume/body mass. This is not measured absorbed dose: absorption, other foods, other routes and duration may differ. The educational quotient is modeled intake divided by a fictional benchmark. It is not a probability, a diagnosis, or an EPA-approved threshold. A value below one does not prove no risk; above one is not proof of illness.
Bioaccumulation concerns concentration within an organism over time as uptake and loss compete. Biomagnification compares concentrations across trophic levels under a comparable measurement basis. The table uses the same dry-mass basis at each level. A ratio across taxa is not a rate of bioaccumulation or proof of a reproductive effect.
Conventional drinking-water treatment commonly combines coagulation, flocculation, sedimentation, filtration and disinfection; utilities adapt treatment to source water and specific contaminants. Wastewater treatment similarly uses staged physical, biological and sometimes additional processes. Neither a clear appearance nor these classroom tests establish potability. Do not drink samples or attempt home treatment as part of this lesson.
[thermal-plume] A heat balance does not measure a safe river: Thermal discharge changes the receiving water’s energy balance even without adding a toxic solute. Under equal density and heat capacity, complete mixing gives a flow-weighted temperature. Added heat relative to the upstream reference is discharge flow × density × heat capacity × temperature difference. Warming can lower oxygen solubility and raise metabolic demand; a fully mixed mean can hide a much warmer near-field plume.
[thermal-plume] A heat balance does not measure a safe river: Model and provenance assumptions: Synthetic river and discharge are steady, with equal density 1000 kg/m³ and heat capacity 4186 J/kg/K. Mixing is complete and instantaneous, with no atmospheric heat exchange. A Celsius temperature difference equals the corresponding kelvin difference; absolute temperatures are not added as energy.
[thermal-plume] A heat balance does not measure a safe river: Uncertainty and inference limits: Discharge temperature ±2 °C bounds the mixed mean at 21.3333–22 °C. Incomplete mixing, changing flow and heat loss can alter local conditions. The optional solubility line is a synthetic equilibrium model, not a dissolved-oxygen measurement or a safety criterion.
[outbreak-cohort] Fictional disease surveillance: association, denominators and bias: Pathogens may move through water, food, contact or vectors; a suspected route is not proof of an identified agent. A retrospective cohort compares new illness proportions among exposed and unexposed people over the same follow-up. Risk ratio divides those proportions, while risk difference subtracts them. Recall bias, case-definition error, shared food and person-to-person transmission can distort a route-specific inference. Epidemiologic association must be integrated with other evidence, not converted into causal proof or clinical advice.
[outbreak-cohort] Fictional disease surveillance: association, denominators and bias: Model and provenance assumptions: The fictional gathering has 100 initially symptom-free people followed for seven days. Case definition: at least three loose stools in a 24-hour period with onset one to three days after the event; each person is counted once. Reported fountain use classifies exposure, not confirmed infection. No real participants or sampling are involved.
[outbreak-cohort] Fictional disease surveillance: association, denominators and bias: Uncertainty and inference limits: Only 18 model cases and unvalidated exposure reports are available. Holding exposed cases at 12, an unexposed count of 5–7 changes the ratio from 3.6 to about 2.5714. These are sensitivity scenarios, not a confidence interval; shared foods and age patterns could confound the association.
[lead-chloride] Pollutant form determines what a filter can remove: Lead can occur in particulate and dissolved forms; corrosion in distribution plumbing can add it after treatment. Chloride is a dissolved ion contributing to salinity and ionic-strength stress, not a particle or pathogen. A particle filter need not remove dissolved lead or salt, and disinfection does not remove every chemical. Pollutant identity, chemical form, source and exposure route belong in a treatment explanation before a device is judged effective.
[lead-chloride] Pollutant form determines what a filter can remove: Model and provenance assumptions: The synthetic filter removes 95% of particulate lead, 10% of dissolved lead and none of chloride, with no dilution or new contamination during the model step. Lead entries share µg/L and can be summed; chloride is mg/L and is a different analyte. Efficiencies are invented, not product claims.
[lead-chloride] Pollutant form determines what a filter can remove: Uncertainty and inference limits: Changing dissolved-lead removal from zero to 20% changes total output from 41 to 33 µg/L. Corrosion after the modeled filter or changing particle size can alter the result. Do not add µg/L lead and mg/L chloride or interpret a removal fraction as a health or potability verdict.

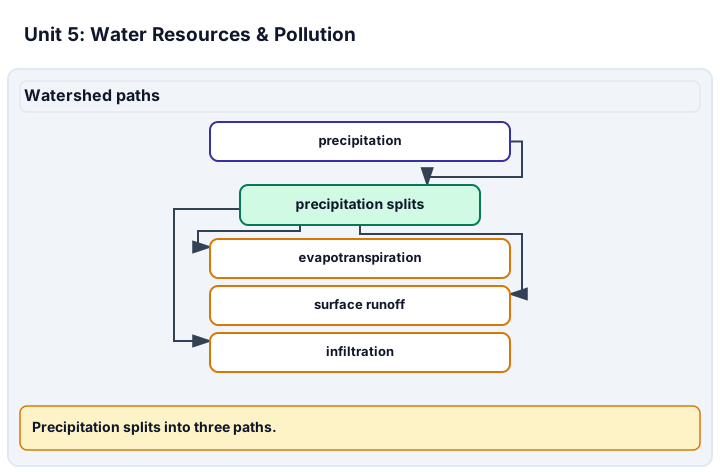
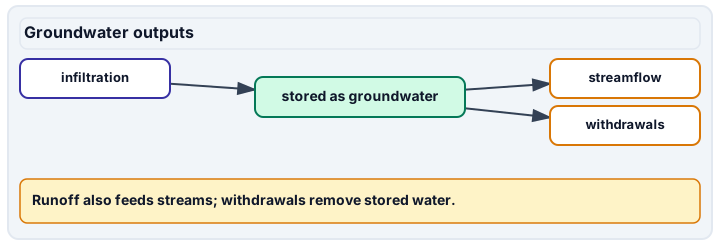
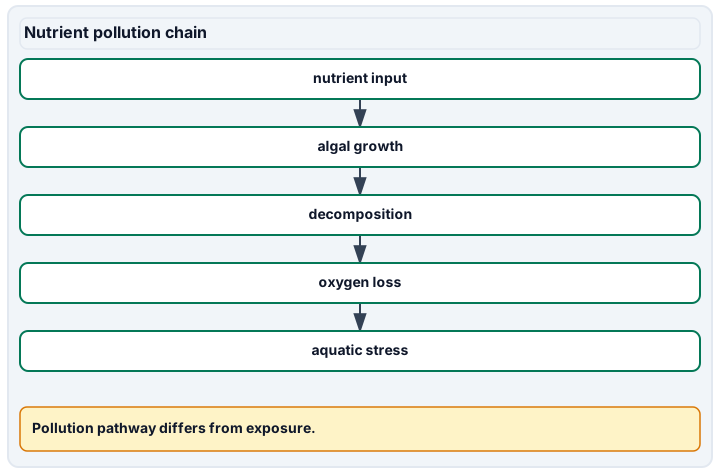
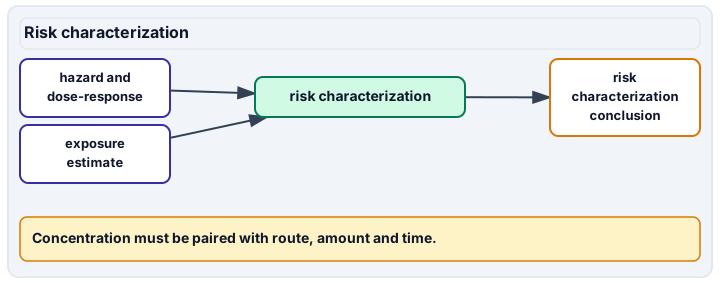
Diagram description
Precipitation moves to runoff, infiltration and evapotranspiration; infiltration adds to groundwater storage; storage and runoff support streamflow; withdrawals remove water from storage. Nutrient pollution proceeds from nutrient input to algal growth, decomposition, oxygen loss and aquatic stress. Risk characterization combines hazard identification, dose-response and exposure estimate from measured concentration, route, amount and time; concentration alone is not risk.
Data, provenance, and assumptions
| Location | Flow (m³/s) | Nitrate (mg N/L) | Dissolved oxygen (mg/L) | Temperature (°C) |
|---|---|---|---|---|
| Upstream | 0.5 | 1 | 9 | 18 |
| Downstream | 1 | 1.5 | 5 | 22 |
| Scenario | X concentration (mg/L) | Intake (L/day) | Body mass (kg) | Fictional benchmark (mg/kg/day) |
|---|---|---|---|---|
| Adult model | 0.01 | 2 | 70 | 0.001 |
| Child model | 0.01 | 1 | 20 | 0.001 |
| Trophic group | Concentration (mg/kg dry mass) |
|---|---|
| Algae | 0.02 |
| Zooplankton | 0.1 |
| Fish | 0.5 |
| River flow (m³/s) | River temperature (°C) | Discharge flow (m³/s) | Discharge temperature (°C) | Water density (kg/m³) | Heat capacity (J/kg/K) |
|---|---|---|---|---|---|
| 10 | 20 | 2 | 30 | 1000 | 4186 |
| Temperature (°C) | Modeled saturation (mg O₂/L) |
|---|---|
| 20 | 9.1 |
| 22 | 8.8 |
| Reported exposure | People at risk at start | New cases during follow-up |
|---|---|---|
| Fountain use reported | 40 | 12 |
| No fountain use reported | 60 | 6 |
| Pollutant form | Inlet concentration | Concentration unit | Removed fraction |
|---|---|---|---|
| Lead particulate | 20 | µg/L | 0.95 |
| Lead dissolved | 40 | µg/L | 0.1 |
| Chloride | 300 | mg/L | 0 |
Worked model
Upstream nitrogen load = 0.5 × 1 × 86.4 = 43.2 kg N/day; downstream = 1 × 1.5 × 86.4 = 129.6, a difference of 86.4. Adult-model intake = 0.01 × 2/70 ≈ 0.000285714 mg/kg/day; child-model intake = 0.0005. Dividing by the invented benchmark gives about 0.286 and 0.5, not probabilities. [thermal-plume] A heat balance does not measure a safe river: Mixed temperature = (10×20+2×30)/12 = 21.666667 °C. Added thermal power = 2×1000×4186×(30−20) = 83720000 J/s = 83.72 MW. The optional linear solubility model gives 8.85 mg/L at that temperature, not actual oxygen in the river. [outbreak-cohort] Fictional disease surveillance: association, denominators and bias: Exposed illness proportion = 12/40 = 0.30; unexposed = 6/60 = 0.10. Risk ratio = 3 and risk difference = 0.20, or 20 percentage points. These are cumulative proportions over the same follow-up, not person-time incidence rates or a statement that the fountain caused every case. [lead-chloride] Pollutant form determines what a filter can remove: Particulate lead output = 20×0.05 = 1 µg/L; dissolved = 40×0.9 = 36 µg/L. Total lead output is 37 versus 60 µg/L entering, so removal is 38.333333%, not 95%. Chloride stays 300 mg/L; it is not added to the lead total.
Numerical calibration
- 43.2 kg N/day
- 129.6 kg N/day
- 86.4 kg N/day
- 0.000285714286 mg/kg/day potential intake
- 0.0005 mg/kg/day potential intake
- 0.285714 dimensionless educational quotient
- 0.5 dimensionless educational quotient
- 1.75 child/adult modeled intake per body mass
- 25 fish/algae concentration ratio
- 21.6666666667 °C complete-mixing mean
- 83.72 MW relative to upstream temperature
- 22 °C high-discharge-temperature mean
- 8.85 mg O₂/L modeled saturation, not measured oxygen
- 22.8571428571 °C low-flow complete-mixing mean
- 3 ratio of seven-day cumulative illness risks
- 20 percentage points of seven-day illness risk
- 2.5714285714 risk ratio with 7 unexposed cases
- 3.6 risk ratio with 5 unexposed cases
- 2 ratio of revised seven-day illness risks
- 37 µg total lead/L
- 38.3333333333 % total lead concentration removed at fixed flow
- 300 mg chloride/L
- 33 µg total lead/L with 20% dissolved removal
- 41 µg total lead/L with zero dissolved removal
- 21 µg total lead/L
Attempt the assigned level
Try the tasks before reading the calibration. These are practice answers, not a secure examination; use a new dataset or changed assumption for the assessed transfer.
Foundation
- Calculate both nitrogen loads and describe the oxygen difference without claiming its cause.
- Sort these questions: ability to cause harm, amount contacting a person, effect at a given dose, and combined characterization.
- [thermal-plume] A heat balance does not measure a safe river: Calculate the complete-mixing temperature and added thermal power. Explain why the two stream temperatures cannot simply be averaged without flow weights.
- [outbreak-cohort] Fictional disease surveillance: association, denominators and bias: Apply the case definition and compute illness proportions for each exposure group. Why must noncases remain in the denominators?
- [lead-chloride] Pollutant form determines what a filter can remove: Calculate output for each pollutant form and total lead output. Explain why chloride is kept separate rather than included in a total pollutant number.
Check after your attempt
- Loads are 43.2 and 129.6 kg N/day. Oxygen is 4 mg/L lower downstream, but temperature and other factors differ.
- The questions concern hazard identification, exposure, dose-response and risk characterization respectively. Concentration alone answers none of them completely.
- [thermal-plume] A heat balance does not measure a safe river: The mean is 21.666667 °C and added power 83.72 MW relative to upstream water. The river carries five times the discharge flow, so an unweighted 25 °C mean misrepresents the heat balance.
- [outbreak-cohort] Fictional disease surveillance: association, denominators and bias: Proportions are 30% and 10%. Risk denominators include every initially at-risk person, not only the ill; removing noncases would turn a risk calculation into a different and meaningless fraction for this question.
- [lead-chloride] Pollutant form determines what a filter can remove: Outputs are 1 and 36 µg/L lead, totaling 37 µg/L; chloride remains 300 mg/L. It has a different chemical identity and unit, so adding the numbers would have no defensible health meaning.
High-school core: typically grades 9-10
- Calculate normalized intake and the educational quotient for both scenarios. Explain why equal concentration gives unequal intake/body mass.
- Calculate fish/algae concentration ratio. State which additional evidence is needed to infer accumulation over time or a health effect.
- [thermal-plume] A heat balance does not measure a safe river: Interpolate the optional saturation value and explain how warming can stress organisms even when no chemical pollutant is added.
- [outbreak-cohort] Fictional disease surveillance: association, denominators and bias: Calculate risk ratio and risk difference and distinguish association from proof of a pathogen or transmission route. Name a plausible confounder.
- [lead-chloride] Pollutant form determines what a filter can remove: Compute overall lead removal and explain why strong particle removal, disinfection or a clear appearance cannot establish chemical safety.
Check after your attempt
- Adult: about 0.000285714 mg/kg/day and 0.286; child: 0.0005 and 0.5. The child-model intake/body-mass ratio is 1.75 times larger despite lower liters/day.
- Fish/algae ratio is 25. Repeated measurements within organisms, uptake/loss evidence, and effect-specific toxicology would be needed; the cross-taxon ratio cannot supply these.
- [thermal-plume] A heat balance does not measure a safe river: The model gives 8.85 mg O₂/L saturation. Warming can lower solubility and increase metabolic demand, but actual oxygen also depends on demand and reaeration; the heat balance does not diagnose ecological safety.
- [outbreak-cohort] Fictional disease surveillance: association, denominators and bias: Risk ratio is 3 and difference 20 percentage points. Shared food choices, contact patterns or age could covary with fountain use; these fictional reports do not identify a pathogen or establish causal proof.
- [lead-chloride] Pollutant form determines what a filter can remove: Lead removal is (60−37)/60 ×100 = 38.333333%. Most remaining lead is dissolved, salt is unchanged and plumbing can add lead later; none of these calculations establishes potability.
Honors extension: typically grades 11-12
- Vary chemical-X concentration from 0.005 to 0.020 mg/L at the same intake/body mass. Bound the child quotient and identify missing exposure terms.
- Design a source-attribution comparison for the river without sampling hazardous water. Specify confounders and a safe supplied-data alternative.
- [thermal-plume] A heat balance does not measure a safe river: Bound the mixed mean for discharge temperatures 28–32 °C, and identify data needed to resolve a near-field plume or low-flow risk.
- [outbreak-cohort] Fictional disease surveillance: association, denominators and bias: Test unexposed cases 5–7, then explain what happens if none are counted. Propose an ethical supplied-record check without culture or exposure experiments.
- [lead-chloride] Pollutant form determines what a filter can remove: Bound lead output for dissolved removal zero to 20% and propose a supplied-record treatment comparison controlling pH, lead form, sampling point and flow.
Check after your attempt
- The child-model quotient ranges from 0.25 to 1. The bounds change no safety verdict; duration, absorption, other routes, other substances and benchmark validity remain unresolved.
- Use repeated upstream/downstream records, tributary flows, rainfall timing, temperature and source inventories. Compare matched conditions and identify uncertainty; use instructor-provided monitoring records rather than entering water or culturing samples.
- [thermal-plume] A heat balance does not measure a safe river: Means range from 21.333333 to 22 °C. Need approved existing spatial temperature/flow records, mixing geometry, seasonal low flows and organism-specific tolerance evidence; the fully mixed average can hide localized stress.
- [outbreak-cohort] Fictional disease surveillance: association, denominators and bias: The ratio ranges 3.6–2.571429; a zero unexposed risk makes the simple ratio undefined, not proof of infinite biological risk. Review anonymized case timing, missing follow-up, exposure recall and stratified comparisons; do not collect samples or expose anyone.
- [lead-chloride] Pollutant form determines what a filter can remove: Output ranges from 41 down to 33 µg/L. Compare matched records at the same point with speciation and corrosion context; a different sampling point or changed water chemistry can confound an apparent treatment effect.
History, reading, and writing connection
Use EPA’s DDT history alongside the four risk-assessment steps. Write how a historical observation, a toxicological mechanism and a regulatory decision differ. Identify both a documented benefit and a concern; do not turn the fictional chemical-X calculation into evidence about DDT or a real person.
Write in your own words or use an approved accessible equivalent. Cite a specific assigned section or figure, identify its evidence, and state one limitation or counterargument. Use the AI practice contract only for permitted coaching, never to invent observations or write the assessed response.
Transfer to a new case
A new fictional exposure uses 0.020 mg/L, 1 L/day and 20 kg body mass. Compute potential intake and its quotient against the same fictional 0.001 benchmark. Is illness certain? [thermal-plume] A heat balance does not measure a safe river: A fresh low-flow model has river flow 5 m³/s at 20 °C and discharge 2 m³/s at 30 °C, with the same mixing assumptions. Find mixed temperature and state why it differs. [outbreak-cohort] Fictional disease surveillance: association, denominators and bias: A fresh record review revises exposed cases to 8 of 40 while unexposed cases remain 6 of 60 under the same follow-up. Find the risk ratio and explain what a change in case counting can do. [lead-chloride] Pollutant form determines what a filter can remove: A fresh hypothetical system removes 50% of dissolved lead while retaining 95% particulate removal. Inputs remain 20 µg/L particulate and 40 µg/L dissolved. Find total output without making a safety claim.
Calibration: Intake is 0.001 mg/kg/day and the quotient 1. It is not a probability or a diagnostic boundary; no illness or safety conclusion follows from this teaching model. [thermal-plume] A heat balance does not measure a safe river: Mixed temperature is (5×20+2×30)/7 ≈ 22.857143 °C. Lower dilution raises the mean, but the simple model still omits plume structure and biological response. [outbreak-cohort] Fictional disease surveillance: association, denominators and bias: The ratio is (8/40)/(6/60) = 2. Correcting records can change an association estimate without changing the biological mechanism; the comparison is still fictional and not clinical advice. [lead-chloride] Pollutant form determines what a filter can remove: Output is 20×0.05 + 40×0.5 = 21 µg/L total lead. Lower concentration does not prove safety or specify a real treatment recommendation.
Evidence to retain
Keep load conversions, source/route/body-mass assumptions, a hazard–exposure–risk diagram and a limitation. Approved practical water testing needs trained supervision, kit-specific disposal and no ingestion, microbial culture or contact with suspect water. [thermal-plume] A heat balance does not measure a safe river: Retain the flow/heat conservation calculation, local-plume caveat, uncertainty bound and oxygen-solubility distinction. Use Unit 5 water-system, pollution, risk-inference and data criteria; no hazardous thermal or water procedure is performed. [outbreak-cohort] Fictional disease surveillance: association, denominators and bias: Retain the fictional label, explicit case/at-risk/follow-up definitions, two association measures, bias analysis and revised-case calculation. Use Unit 5 pollution, risk, treatment/health and data criteria without diagnosing or asserting causation. [lead-chloride] Pollutant form determines what a filter can remove: Retain form-specific outputs, overall lead removal, separate chloride units, a corrosion/source diagram and uncertainty bounds. Use Unit 5 pollutant/risk/treatment/data criteria; this is not a drinking-water assessment or performed sampling.
Record units, calculations, source/date, uncertainty, and what is measured versus inferred. A simulation or supplied dataset must stay labeled as such. Use supplied data or an instructor-approved supervised observation. No electrical work, combustion, radioactive materials, pesticide application, wildlife capture, microbial culture, hazardous sampling or sample ingestion is authorized.
Return to all eight learning pathways. Print this unit page for the student lessons; the linked five-page packet remains the separate assessment companion.
Unit mastery rubric
| Criterion | Developing | Proficient | Mastery |
|---|---|---|---|
| Watersheds and groundwater budgets | Treats groundwater as unlimited. | Names recharge and withdrawal. | Traces watershed/groundwater flows and compares recharge, withdrawal and ecosystem needs within a stated boundary. |
| Pollution sources and loads | Treats concentration as mass load. | Classifies sources with help. | Distinguishes point/nonpoint inputs, calculates concentration × flow, and states limits on source attribution. |
| Nutrients, oxygen and aquatic effects | Equates low oxygen with one cause. | Describes enrichment incompletely. | Explains nutrient/oxygen pathways and thermal discharge; balances heat while distinguishing BOD, solubility, actual oxygen and ecological inference. |
| Treatment, exposure and health risk | Calls clear water safe. | Names treatment or risk steps. | Explains treatment limits; separates hazard, dose-response and exposure; calculates normalized intake without a health verdict. |
| Water-measurement technique | Contaminates or misreads samples. | Records tests with reminders. | Demonstrates approved DO/nitrate/turbidity/pH measurement or an approved alternative, with calibration, units and no potability claim. |
| Integration (cross-domain) | Makes no supported connection between the source and the science. | Uses the source but needs help connecting evidence, writing, or limitations to the science. | Independently connects History, Reading, and Writing using a cited source, appropriate evidence, a limitation, and a scientific explanation. |
Integration is reported separately and cannot lower the science grade or block a science demonstration pass. Science and practical criteria determine that pass. Use the integration guide's evidence checklist for the separately reported criterion.
Downstream nitrogen load is 129.6 kg N/day under a constant-flow assumption. Oxygen is lower, but I have not established why. The fictional exposure quotient is not a disease probability or drinking-water certification.
The water looks clear and my quotient is below one, so everyone can drink it.
Observe approved safe testing separately from data interpretation. Do not approve ingestion, contamination experiments or a health diagnosis based on this packet.
A 5-page clipboard packet — unit overview, key terms, the mastery rubric, anchor examples, and a score sheet you can print and grade against.