Teaching examples, not student testimonials. The sample week, model notebook, and demonstration prompts illustrate the intended learning process; they do not report an enrolled student's results. Current program status and next steps.
Look inside the Health & Nutrition pack.
No sign-up, no email required. Here is a sample week, a real rubric, a model lab-notebook entry, and a sample demonstration. These are the materials themselves, not a brochure. Every sample links to the full artifact it’s drawn from.
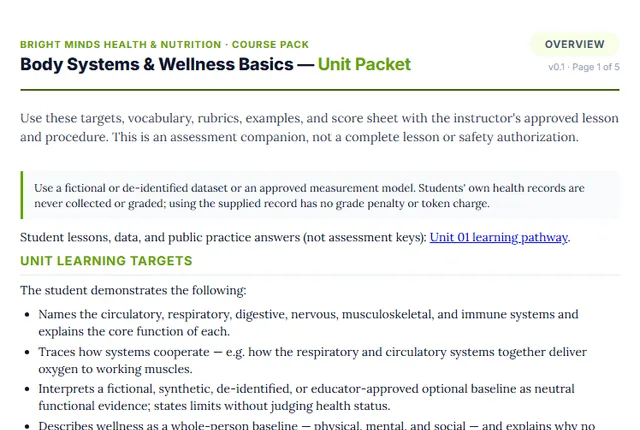
One week, two days on the body.
The course meets two days a week for about two hours a day, across roughly 32 weeks. Here is week one of Unit 1 — Body Systems & Wellness Basics: the student measures their own baseline for real before a single health claim is taken on faith.
- The six major body systems
- How systems work together
- Reading: from Galen to modern physiology
- Take a resting-heart-rate baseline
- Record every value with units
- Read numbers as data, not verdicts
How “mastered” is actually judged.
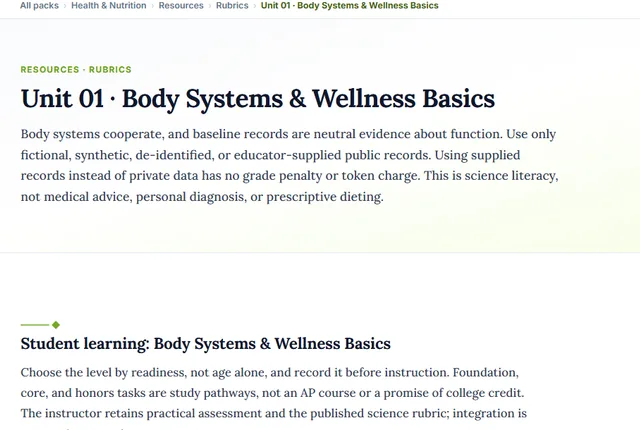
Every skill is scored at one of three levels against a published standard, without points or grading on a curve. Here is one criterion from the Body Systems & Wellness rubric — reading your own baseline data, shown as a parent or guide would read it:
| Level | What it looks like — “Read your own baseline data” |
|---|---|
| Developing | Cannot take or read a simple baseline measurement like a resting heart rate. |
| Proficient | Records a measurement but treats the number as a verdict rather than as data. |
| Mastery | Takes a resting-heart-rate baseline and reads it calmly as neutral data about function — never as a judgment about body size or looks. |
Browse the full rubric set → · How this becomes an A–F grade →
The artifact a student builds, keeps, and defends.
The lab notebook is the primary record of a student's work, written in pen at the bench and explained aloud. Here is one model day at the bench, showing how each section is recorded. Notice the crossed-out slip and the honest sources of error.
| Cereal | Sugar/serving | Sugar/100 g |
|---|---|---|
| A (“wholesome”) | 12 g (40 g) | 30 g |
| B (plain) | 4 g (30 g) | 13 g |
- Dated & titled entries
- A testable question & hypothesis
- Units on every number
- Significant figures, honestly reported
- Calculations shown, not just answers
- Written in pen during the lab; errors crossed out, not erased
- Error analysis with direction & size
The moment that can’t be faked.
Three times a year, a student performs and defends a demonstration, standing with their own work and reasoning aloud while an adult asks unscripted follow-ups. In the nutrition-analysis defense, they analyze a real food or diet using nutrition data and defend an evidence-based recommendation.
“Per 100 g this ‘protein’ bar has 22 g of added sugar and only 6 g of protein — it’s closer to a candy bar. I’d swap it for Greek yogurt and nuts: same protein, about a third of the sugar.”
A passing answer from the nutrition-analysis defense — reasoning from the label data and separating science from marketing, not reciting a slogan.
The whole pack, ready for a binder.
Everything here is available to read online. Every rubric, checklist, and guide also has a print-ready packet version, formatted 8.5×11 for a clipboard or a three-ring binder. You assemble the student’s binder from the pack itself; there’s nothing else to buy to hold it in your hands. We’ve put them all in binder order on one page: Assemble the Health & Nutrition binder →
Seen enough to start?
The whole Health & Nutrition pack is open to read and print. Open it and begin, or ask us a question first. A real person answers.