Unit 01 · The Ocean Environment
Pelagic means water column; benthic means bottom habitat. A bottom can be sunlit in shallow water or dark in the abyss. The euphotic depth is not a fixed 200 m boundary: turbidity and season change light penetration. The conventional 1% surface-light depth is a useful optical reference, not a universal biological compensation depth.
Student learning: Read a layered ocean: salinity, oxygen, temperature and light
Choose the level by readiness, not age alone, and record it before instruction. Foundation, core, and honors tasks are study pathways, not an AP course or a promise of college credit. The instructor retains practical assessment and the published science rubric; integration is reported separately.
Prerequisites: Mass, volume, depth, graph axes, ratios, and the distinction between measured properties and a model prediction.
Suggested sequence: read and discuss the explanation; attempt the worked model; analyze the data at your selected level; check the answers; then complete the source-linked response and a fresh transfer question. These activities supplement, not replace, supervised practical work and the full-year schedule.
Assigned reading and focus
- NOAA: How far does light travel in the ocean?. Read the sunlight, twilight and aphotic descriptions and infographic transcript. Treat their depth bands as broad oceanographic conventions, not a fixed 200 m photosynthetic boundary at every site.
- NOAA Estuaries Tutorial: Estuarine Circulation. Read the introduction and Salt-wedge Estuaries. Explain how freshwater input, tides and wind affect mixing, then compare that mechanism with the supplied vertical profile.
Learn the science
Pelagic means water column; benthic means bottom habitat. A bottom can be sunlit in shallow water or dark in the abyss. The euphotic depth is not a fixed 200 m boundary: turbidity and season change light penetration. The conventional 1% surface-light depth is a useful optical reference, not a universal biological compensation depth.
Practical Salinity (PSS-78) is dimensionless, often informally labeled PSU. A mass fraction in g salt/kg solution is a different measure; they are not interchangeable at arbitrary precision. Temperature-compensated conductivity or refractive-index readings need standards, a stated scale, and calibration. A hydrometer measures density, from which salinity is inferred with temperature and composition assumptions.
At comparable pressure, cooler or saltier seawater is usually denser. Fresh surface input can stabilize an estuary above saltier water. Wind and tides can mix it; a stratified profile does not prove there is no exchange. Wind-driven upwelling can supply nutrients, while density differences contribute to overturning circulation; neither process is simply waves moving water in place.
Dissolved oxygen reflects gas exchange, photosynthesis, respiration and transport. Warm water holds less oxygen at saturation than cold water of the same salinity and pressure, but a measured oxygen minimum is not explained by temperature alone. Stratification can restrict resupply while decomposers consume oxygen below.
Gauge pressure excludes the atmosphere; absolute pressure includes it. Use the approximate teaching rule of one additional atmosphere per 10 m, not an exact pressure conversion. Never use this model to plan a dive or to infer human tolerance.

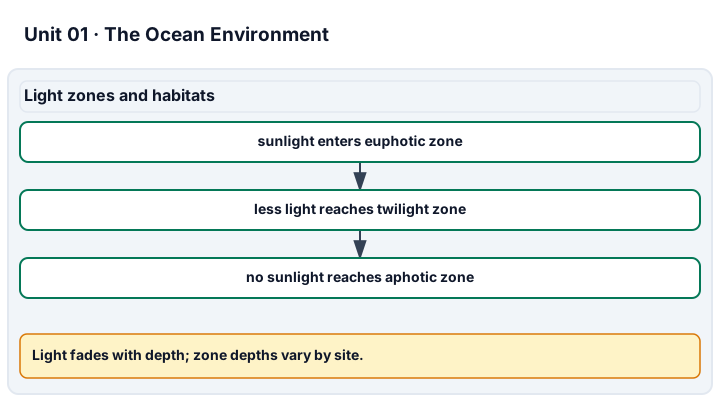
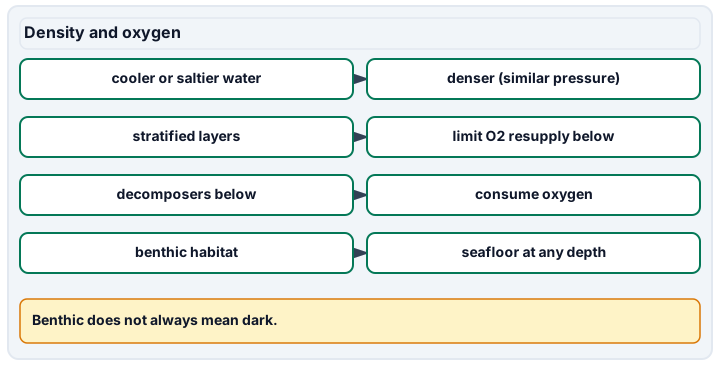
Diagram description
The first panel follows sunlight down the water column: light enters the euphotic zone, less light reaches the twilight zone, and no sunlight reaches the aphotic zone; zone depths vary by site. Pelagic means the water column, while benthic means seafloor habitat at any depth. Cooler or saltier water is usually denser at similar pressure, stratification can limit oxygen resupply below, and decomposers can consume oxygen in lower layers.
Data, provenance, and assumptions
| Depth (m) | Temperature (degrees C) | Practical Salinity (dimensionless) | Dissolved oxygen (mg/L) | Surface light (%) |
|---|---|---|---|---|
| 0 | 22 | 12 | 8 | 100 |
| 5 | 20 | 20 | 6 | 50 |
| 10 | 16 | 30 | 4 | 20 |
| 20 | 12 | 34 | 3 | 1 |
| Water component | Solution mass (kg) | Salt mass fraction (g/kg) |
|---|---|---|
| Fresh component | 3 | 0 |
| Marine component | 1 | 35 |
Worked model
From surface to 20 m, salinity increases by 22 over 20 m: the average gradient is 1.1 per metre. Oxygen decreases by 5 mg/L. At 20 m the approximate gauge pressure is 2 atm and absolute pressure 3 atm. The separate mixing model contains 3×0 + 1×35 = 35 g salt in 4 kg solution: 8.75 g/kg. It does not predict a high-precision conductivity-based salinity.
Numerical calibration
- 1.1 Practical Salinity per m
- 5 mg O2/L decrease
- 3 atm, approximate absolute pressure at 20 m
- 8.75 g salt/kg solution
Attempt the assigned level
Try the tasks before reading the calibration. These are practice answers, not a secure examination; use a new dataset or changed assumption for the assessed transfer.
Foundation
- Plot temperature and oxygen separately against depth; label pelagic, benthic and the light reference.
- Find the salinity change and absolute pressure at 20 m. Explain why a dark bottom need not be lifeless.
Check after your attempt
- Temperature decreases from 22 to 12 degrees C and oxygen from 8 to 3 mg/L. The 1% light reference is 20 m in this constructed profile; the bottom is a habitat, not a light band.
- Salinity changes by 22; approximate absolute pressure is 3 atm. Sinking organic matter and local chemosynthetic production can support food webs without local sunlight.
High-school core: typically grades 9-10
- Compute mean salinity gradient, oxygen difference and mixed salt fraction, with the correct denominators.
- Compare surface and deep layers; propose two oxygen mechanisms and a measurement to distinguish them.
Check after your attempt
- The results are 1.1 per m, 5 mg/L decrease and 8.75 g/kg. Use combined solution mass, not the 1 kg marine component alone, for mixing.
- The cooler, saltier layer is likely denser; restricted ventilation and respiration could reduce oxygen. Repeated oxygen profiles plus mixing/current observations help distinguish transport from biological demand.
Honors extension: typically grades 11-12
- Bound the endpoint salinity gradient if each salinity reading can be wrong by 0.5; depths are exact for this exercise.
- Replace the 3 kg fresh component with 2 kg. Recalculate and state why one vertical profile cannot establish a seasonal circulation pattern.
Check after your attempt
- The difference ranges from 21 to 23, giving 1.05–1.15 per m. Endpoint errors add for a conservative bound; this is not a statistical confidence interval.
- The new mass fraction is 35/3 = 11.667 g/kg. Tide, discharge, wind and season may differ; repeat profiles across times and independent stations.
History, reading, and writing connection
Write a 150–200 word source comparison using NOAA’s light infographic and Salt-wedge Estuaries section: how would sparse historical soundings differ from a modern profile? A supported response explains measurement scale, stratification and station coverage; it does not claim the synthetic table was collected by HMS Challenger. Cite both sections and identify one unmeasured driver.
Write in your own words or use an approved accessible equivalent. Cite a specific assigned section or figure, identify its evidence, and state one limitation or counterargument. Use the AI practice contract only for permitted coaching, never to invent observations or write the assessed response.
Transfer to a new case
A turbid estuary reaches 1% light at 4 m, not 20 m. Does a 10 m seabed have to be photosynthetic because it is shallower than 200 m?
Calibration: No. The local light record, organism requirements and respiration matter. The 200 m convention cannot override site-specific attenuation.
Evidence to retain
Keep two labeled profiles, the mass-balance working, instrument/scale explanation and endpoint uncertainty. Supplied readings do not certify hydrometer, refractometer or probe handling; record any separately supervised instrument demonstration as observed rather than inferred.
Record units, calculations, source/date, uncertainty, and what is measured versus inferred. A simulation or supplied dataset must stay labeled as such. The inland supplied-data pathway is available in every unit with equivalent analysis evidence, not a performed field/practical credential. Optional observations require instructor and site approval from a dry, accessible location. No diving, breath-holding, marine-mammal physiology imitation, boats, wading, hazardous tidal sites, handling wild animals, unapproved collection, ingestion, unknown-microbe culture, or hatchery experiments.
Return to all eight learning pathways. Print this unit page for the student lessons; the linked five-page packet remains the separate assessment companion.
Unit mastery rubric
| Criterion | Developing | Proficient | Mastery |
|---|---|---|---|
| Ocean zones & structure | Confuses water column with seafloor. | Names zones but assumes fixed light boundaries. | Distinguishes pelagic/benthic habitats and interprets local light data without a universal 200 m cutoff. |
| Salinity & seawater properties | Equates every salinity scale or omits units. | Relates salinity to density with help. | Explains salinity scales, temperature and stratification; interprets a calibrated reading and conserves salt in a mass-balance model. |
| Depth: temperature, oxygen, pressure & light | Reads axes or pressure reference incorrectly. | Reads profiles but misses uncertainty or mechanism. | Graphs profiles with units, calculates gradients and oxygen differences, and distinguishes gauge from absolute pressure with limits. |
| Currents & circulation | Treats currents as water standing still. | Names wind or density but not their effects. | Links wind, density, tides and upwelling to oxygen/nutrient transport; limits conclusions from a single profile. |
| Lab technique (water-property evidence) | Invents readings or omits measurement context. | Records values but needs help with scale or provenance. | Records scale, temperature, calibration and uncertainty for approved instrument work, or completes labeled data analysis without claiming tool proficiency. |
| Integration (cross-domain) | Makes no supported connection between the source and the science. | Uses the source but needs help connecting evidence, writing, or limitations to the science. | Independently connects History, Reading, and Writing using a cited source, appropriate evidence, a limitation, and a scientific explanation. |
Integration is reported separately and cannot lower the science grade or block a science demonstration pass. Science and practical criteria determine that pass. Use the integration guide's evidence checklist for the separately reported criterion.
The supplied profile loses 5 mg O2/L over 20 m while salinity rises by 22. That is consistent with stratification plus oxygen use, not proof of either mechanism alone. Pressure at 20 m is about 3 atm absolute, not 2.
A reading labeled 35 is incomplete without its scale. Ask for instrument, temperature and calibration; do not pretend a supplied reading demonstrates handling.
Keep two labeled profiles, the mass-balance working, instrument/scale explanation and endpoint uncertainty. Supplied readings do not certify hydrometer, refractometer or probe handling; record any separately supervised instrument demonstration as observed rather than inferred. Integration is reported separately and cannot lower the science grade or block a science demonstration pass. Science and practical criteria determine that pass.
A 5-page clipboard packet — unit overview, key terms, the mastery rubric, anchor examples, and a score sheet you can print and grade against.