Unit 02 · Plankton & Primary Production
Plankton is an ecological lifestyle, not a taxonomic group. Photosynthetic cyanobacteria are prokaryotes; diatoms and many dinoflagellates are eukaryotes. Zooplankton include grazers and predators; mixotrophs both photosynthesize and consume food. Holoplankton remain planktonic through their life cycle; meroplankton include temporary larval stages.
Student learning: Follow carbon through plankton, respiration and the microbial loop
Choose the level by readiness, not age alone, and record it before instruction. Foundation, core, and honors tasks are study pathways, not an AP course or a promise of college credit. The instructor retains practical assessment and the published science rubric; integration is reported separately.
Prerequisites: Unit 1 water context; millilitres versus litres, rates, percentages, and conservation of matter.
Suggested sequence: read and discuss the explanation; attempt the worked model; analyze the data at your selected level; check the answers; then complete the source-linked response and a fresh transfer question. These activities supplement, not replace, supervised practical work and the full-year schedule.
Assigned reading and focus
- NASA Earth Observatory: What are Phytoplankton?. Read Importance of phytoplankton, Studying phytoplankton, and Differences from place to place. Distinguish an ocean-color chlorophyll proxy from a direct count or production measurement. The described professional sampling is not a student procedure.
- NOAA: How much oxygen comes from the ocean?. Read the paragraphs contrasting oxygen production, marine consumption and atmospheric accumulation. Explain why oxygen production is not a direct measure of addition to the atmospheric oxygen reservoir.
- Microorganisms (2021): Shift from Carbon Flow through the Microbial Loop to the Viral Shunt. Read the Abstract and first three Introduction paragraphs only. Draw DOM → bacteria → heterotrophic nanoflagellates and the viral shunt. Contrast the Antarctic seasonal finding with this fictional budget; do not perform the paper’s collection or laboratory methods.
Learn the science
Plankton is an ecological lifestyle, not a taxonomic group. Photosynthetic cyanobacteria are prokaryotes; diatoms and many dinoflagellates are eukaryotes. Zooplankton include grazers and predators; mixotrophs both photosynthesize and consume food. Holoplankton remain planktonic through their life cycle; meroplankton include temporary larval stages.
Photosynthesis fixes inorganic carbon into organic matter using light energy. Producers also respire in the light and dark. Gross primary production minus producer respiration is net primary production (NPP). In a mixed plankton community, light-bottle oxygen change is net community production, NOT net primary production: heterotrophs also consume oxygen.
For matched closed bottles, R = (initial O2 − dark O2)/time; net = (light O2 − initial O2)/time; gross = net + R. The gross estimate assumes light and dark respiration are comparable, no air exchange, matched starting communities and negligible bottle artifacts. Do not convert oxygen to carbon without a stated stoichiometric assumption or extend a four-hour light rate through a 24-hour day.
The microbial loop returns some dissolved organic carbon (DOC) to the food web: heterotrophic bacteria take up DOC released by exudation, feeding and decomposition; protists graze bacteria and are eaten by larger consumers. Bacteria respire much of the carbon as CO2. Remineralization returns inorganic nutrients; it does not create new carbon. Matter cycles while usable energy dissipates as heat.
Viral lysis can redirect cell material into dissolved organic matter instead of grazer biomass. The relative microbial loop and viral shunt vary among places and seasons. A net sample misses many bacteria and small cells, so visible plankton counts cannot quantify the whole microbial loop. The biological pump exports some particulate organic carbon below the surface, but much is remineralized before long-term storage.
Light, nitrogen, phosphorus, iron, temperature, stratification and grazing can limit blooms. Upwelling supplies nutrients but does not guarantee growth if light or another resource is limiting. NASA ocean color is a surface-biased proxy; chlorophyll stock is not the same as a photosynthetic rate. Roughly half of global oxygen production is oceanic, not half of a permanently accumulating atmospheric supply.

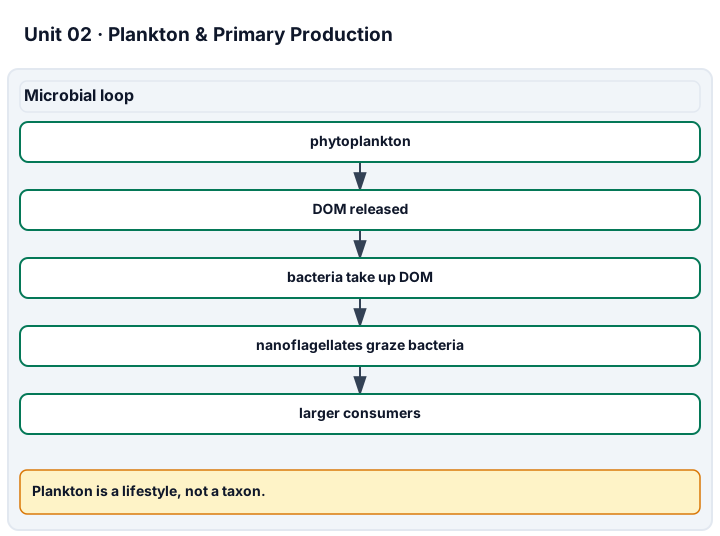
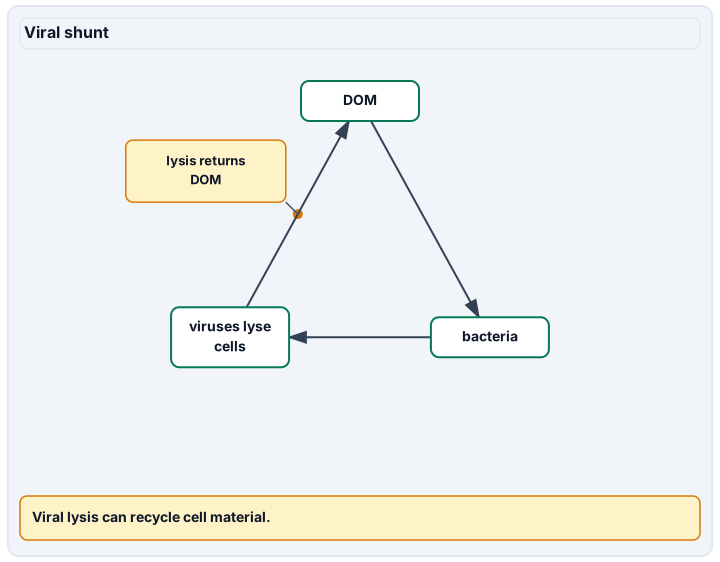
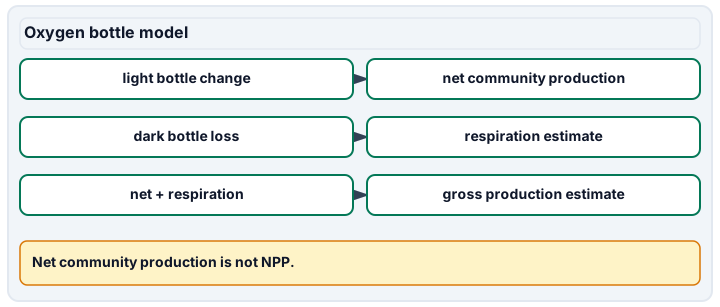
Diagram description
Phytoplankton can release dissolved organic matter, bacteria take up DOM, nanoflagellates graze bacteria, and larger consumers can use that path. Viral lysis can redirect bacterial cell material back to DOM. Oxygen bottle calculations are net community production, respiration, and gross production estimates under the model assumptions.
Data, provenance, and assumptions
| Aliquot | Aliquot volume (mL) | Diatom cells | Copepods | Invertebrate larvae |
|---|---|---|---|---|
| A1 | 1 | 18 | 2 | 0 |
| A2 | 1 | 22 | 1 | 1 |
| A3 | 1 | 20 | 3 | 2 |
| Concentrate volume (mL) | Original sampled water (L) | Assumed recovery fraction |
|---|---|---|
| 100 | 50 | 0.8 |
| Pair | Initial O2 (mg/L) | Light final O2 (mg/L) | Dark final O2 (mg/L) | Elapsed time (h) |
|---|---|---|---|---|
| B1 | 8 | 9.2 | 7.4 | 4 |
| B2 | 8 | 8.9 | 7.3 | 4 |
| DOC uptake | Bacterial production | Bacterial respiration | Bacteria grazed | Protist production | Protist respiration |
|---|---|---|---|---|---|
| 100 | 30 | 70 | 20 | 8 | 12 |
Worked model
Sixty diatoms in 3 mL give 20 cells/mL concentrate, then 20×100/50 = 40 cells/L original water. Copepods and larvae are 4 and 2/L. Mean final light O2 is 9.05 and dark O2 7.35 mg/L: net community production = 0.2625, respiration = 0.1625, gross = 0.425 mg O2/L/h. Carbon accounting closes: 100 = 70 bacterial respiration + 12 protist respiration + 8 protist biomass + 10 ungrazed bacterial biomass.
Numerical calibration
- 40 diatom cells/L original water
- 4 copepods/L original water
- 2 larvae/L original water
- 57.5 counted objects/L, assumed 80% recovery
- 0.2625 mg O2/L/h
- 0.1625 mg O2/L/h oxygen consumption
- 0.425 mg O2/L/h
- 0.05 mg O2/L/h bounded endpoint uncertainty
- 30 % of DOC uptake retained in bacterial production
- 8 % of DOC uptake retained in protist production
Attempt the assigned level
Try the tasks before reading the calibration. These are practice answers, not a secure examination; use a new dataset or changed assumption for the assessed transfer.
Foundation
- Classify diatoms, copepods and larvae by role and the supplied life-history information, flagging anything not determined; calculate total counts in the analyzed 3 mL.
- Draw the microbial loop and explain why the dark bottles lose oxygen even though phytoplankton are present.
Check after your attempt
- There are 60 diatoms, 6 copepods and 3 larvae. Diatoms are producers; copepods are zooplankton; the stated benthic-adult larvae are meroplankton. The other categories cannot establish holo/mero status without species life history; size or a count alone is insufficient.
- DOC feeds bacteria; protists graze them. Respiration by producers and consumers uses oxygen in darkness; photons are unavailable for oxygenic photosynthesis.
High-school core: typically grades 9-10
- Compute the three original-water densities and net, respiratory and gross oxygen rates.
- Compute bacterial growth efficiency and the fraction of DOC uptake returned as protist production; explain the lost-energy pathway.
Check after your attempt
- Densities are 40 cells/L, 4 copepods/L and 2 larvae/L. Oxygen rates are 0.2625 net, 0.1625 respiratory and 0.425 gross mg/L/h under the matched-bottle assumptions.
- Bacterial growth efficiency is 30/100 = 30%; protist return is 8/100 = 8%. Respired carbon returns as CO2 while energy dissipates as heat; carbon transfer efficiencies are not automatically energy efficiencies.
Honors extension: typically grades 11-12
- Apply the hypothetical 80% recovery to the combined count density; bound the net oxygen rate using endpoint errors of 0.1 mg/L.
- Explain why the Antarctic paper’s seasonal loop-to-shunt change cannot be calculated from these visible plankton counts or generalized to every ocean.
Check after your attempt
- The combined uncorrected density is 46/L; 46/0.8 = 57.5/L if equal recovery applies to all categories. The net rate bound is ±(0.1+0.1)/4 = ±0.05, or 0.2125–0.3125 mg/L/h; do not divide a systematic bound by the number of pairs.
- Bacterial production, grazing and viral infection require different measurements. The assigned paper concerns a particular Antarctic season; these synthetic counts contain no viral observations and are not an independent replication.
History, reading, and writing connection
Compare NASA’s Studying phytoplankton section, NOAA’s oxygen-consumption explanation and the microbial-loop paper’s Abstract. Write a claim/evidence/limitation response on what microscopy, satellites and microbial-rate measurements each reveal. A checked response distinguishes count, pigment stock and rate, notes the paper’s seasonal scope, and rejects “half our oxygen” as proof of permanent oxygen accumulation.
Write in your own words or use an approved accessible equivalent. Cite a specific assigned section or figure, identify its evidence, and state one limitation or counterargument. Use the AI practice contract only for permitted coaching, never to invent observations or write the assessed response.
Transfer to a new case
A second concentrate has the same counts per mL but comes from 100 L rather than 50 L of water. Does it imply the same original-water density?
Calibration: No. At the same 100 mL concentrate volume, all original-water densities halve: 20 diatoms, 2 copepods and 1 larva/L. More concentrated-looking water is not enough information.
Evidence to retain
Retain the volume chain, category identifications, oxygen and carbon budgets, recovery sensitivity and cited comparison. Count sheets are not microscope images; use approved prepared slides only with instruction and record that practical separately. Inland analysis requires no tow, incubation or culture.
Record units, calculations, source/date, uncertainty, and what is measured versus inferred. A simulation or supplied dataset must stay labeled as such. The inland supplied-data pathway is available in every unit with equivalent analysis evidence, not a performed field/practical credential. Optional observations require instructor and site approval from a dry, accessible location. No diving, breath-holding, marine-mammal physiology imitation, boats, wading, hazardous tidal sites, handling wild animals, unapproved collection, ingestion, unknown-microbe culture, or hatchery experiments.
Return to all eight learning pathways. Print this unit page for the student lessons; the linked five-page packet remains the separate assessment companion.
Unit mastery rubric
| Criterion | Developing | Proficient | Mastery |
|---|---|---|---|
| Plankton types & classification | Treats plankton as one taxon. | Separates producers and consumers but confuses life stages. | Classifies producer/consumer roles and holo/meroplankton, including photosynthetic bacteria and mixotrophic exceptions. |
| Primary production & respiration | Confuses oxygen stock with production. | Explains photosynthesis but omits respiration. | Calculates light/dark net community, respiration and gross rates; distinguishes NPP and states bottle assumptions. |
| Nutrients, upwelling & blooms | Assumes equal growth everywhere. | Names a limiting resource without context. | Links light, nutrients, grazing and stratification to blooms; distinguishes chlorophyll stock from production rate. |
| Microbial loop & biological pump | Omits bacteria or claims energy is recycled. | Traces a food chain but misses dissolved carbon. | Balances DOC, bacterial/protist production and respiration; explains remineralization, viral shunt and uncertain carbon export. |
| Lab technique (plankton evidence) | Reports counts without volume or invents observations. | Counts correctly but loses a subsampling factor. | Uses aliquot, concentrate and source-water volumes; records sampling bias and separates supplied analysis from observed microscopy. |
| Integration (cross-domain) | Makes no supported connection between the source and the science. | Uses the source but needs help connecting evidence, writing, or limitations to the science. | Independently connects History, Reading, and Writing using a cited source, appropriate evidence, a limitation, and a scientific explanation. |
Integration is reported separately and cannot lower the science grade or block a science demonstration pass. Science and practical criteria determine that pass. Use the integration guide's evidence checklist for the separately reported criterion.
The synthetic diatom density is (60/3)×100/50 = 40 cells/L. Light-bottle change gives 0.2625 mg O2/L/h net community production, not NPP. Of 100 micrograms DOC-C used per litre per day, only 8 appears as protist production in this budget.
A green satellite pixel estimates pigments near the surface, not a bacterial count. A correctly calculated supplied count sheet does not demonstrate a tow or microscope setup.
Retain the volume chain, category identifications, oxygen and carbon budgets, recovery sensitivity and cited comparison. Count sheets are not microscope images; use approved prepared slides only with instruction and record that practical separately. Inland analysis requires no tow, incubation or culture. Integration is reported separately and cannot lower the science grade or block a science demonstration pass. Science and practical criteria determine that pass.
A 5-page clipboard packet — unit overview, key terms, the mastery rubric, anchor examples, and a score sheet you can print and grade against.