Unit 08 · Humans & the Ocean
Catch is a removal flow over a period; a stock is a population quantity at a time. Catch per unit effort (CPUE) divides catch by a defined fishing effort. If catchability q is constant, CPUE may track relative abundance, but technology, targeting, regulations, aggregation and habitat can change q. A simulated catch dataset is not a validated stock assessment.
Student learning: Evaluate fisheries and carbonate stress without overclaiming
Choose the level by readiness, not age alone, and record it before instruction. Foundation, core, and honors tasks are study pathways, not an AP course or a promise of college credit. The instructor retains practical assessment and the published science rubric; integration is reported separately.
Prerequisites: Units 1–7 mechanisms and sampling; percent change, rates, ratios; honors uses powers of ten.
Suggested sequence: read and discuss the explanation; attempt the worked model; analyze the data at your selected level; check the answers; then complete the source-linked response and a fresh transfer question. These activities supplement, not replace, supervised practical work and the full-year schedule.
Assigned reading and focus
- NOAA Fisheries: Understanding Population Assessments. Read Fish stock assessments: identify the demographic evidence needed to judge overfishing or sustainable harvest. Treat the text as an explanation of professional assessment, not a certification of the classroom model.
- NOAA Fisheries: From Survey to Stock Assessments — How the Data Are Used. Read the paragraphs on sampled area, relative abundance, biological sampling and the concluding fishery-independent data comparison. Identify why standardization, age, growth and recruitment matter; do not reproduce collection methods.
- NOAA: What is ocean acidification?. Read the CO2, hydrogen-ion and carbonate paragraphs. Trace the mechanism from dissolved CO2 to altered carbonate availability and distinguish a chemical trend from a universal species response.
- NOAA: What is coral bleaching?. Read the first two paragraphs and the stressors in the infographic. Distinguish temperature-related symbiont disruption from carbonate chemistry; bleaching is not automatically death.
Learn the science
Catch is a removal flow over a period; a stock is a population quantity at a time. Catch per unit effort (CPUE) divides catch by a defined fishing effort. If catchability q is constant, CPUE may track relative abundance, but technology, targeting, regulations, aggregation and habitat can change q. A simulated catch dataset is not a validated stock assessment.
A standardized fishery-independent survey adds evidence because it does not follow commercial targeting alone. It is still an index with selectivity, detection and sampling uncertainty. A real assessment integrates recruitment, growth, natural/fishing mortality, age structure, landings and discards; a catch curve alone cannot establish overfishing or sustainable yield.
CO2 in seawater participates in equilibria producing hydrogen ions and bicarbonate. Hydrogen ions react with carbonate to form more bicarbonate, often reducing carbonate availability for calcium-carbonate formation. pH is logarithmic on its stated scale; seawater can become more acidic while still being alkaline (above pH 7). pH alone cannot determine carbonate concentration: alkalinity, dissolved inorganic carbon, salinity and temperature matter.
Calcifiers regulate chemistry at the site of shell or skeleton formation and can face greater costs as carbonate conditions change; species and life stages differ. Thermal stress can disrupt a coral’s symbionts and cause bleaching. Warming, acidification and oxygen loss can co-occur but have distinct mechanisms; an apparent shell-growth trend does not prove acidification caused bleaching.
Nutrient runoff can promote blooms, whose decomposition uses oxygen; stratification limits replenishment. Plastics can cause entanglement or ingestion harm, and oil has toxic and physical effects. An index of litter is not a measured toxin dose. Source reduction, habitat protection and emissions policy address different pressures.
A marine protected area may protect spawning adults and habitat, but benefit depends on compliance, boundaries, movement, larval connectivity and outside pressures. It cannot alone reverse global acidification. Proposals must name a mechanism, indicators, uncertainty and a comparison, not promise recovery from one chosen management tool.

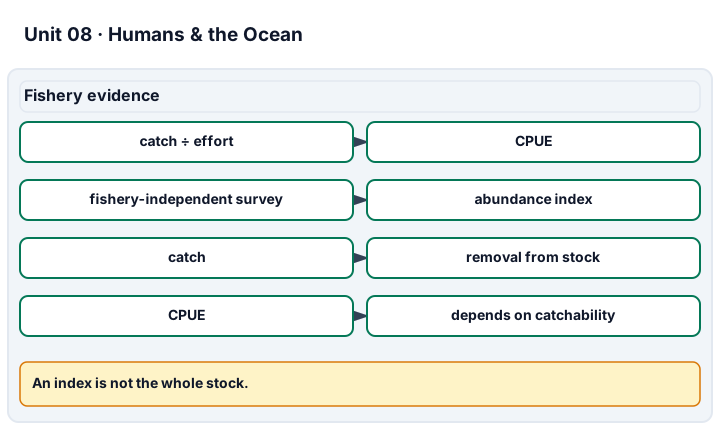
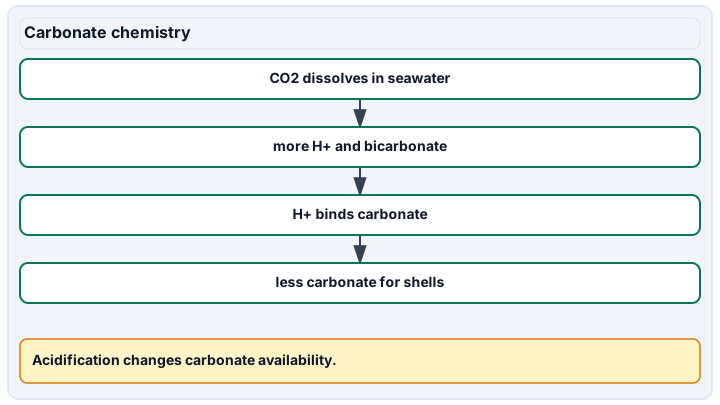
Diagram description
Fishery evidence distinguishes stock, catch, effort, CPUE, catchability, and fishery-independent survey index. Carbon dioxide in seawater increases hydrogen ions and bicarbonate; hydrogen ions bind carbonate, reducing carbonate availability for shell-building organisms. This is not chemical reduction.
Data, provenance, and assumptions
| Year code | Catch (tonnes/year) | Effort (boat-days/year) | Survey index | Index lower bound | Index upper bound | Temperature (degrees C) | Practical Salinity | Oxygen (mg/L) |
|---|---|---|---|---|---|---|---|---|
| Y1 | 100 | 50 | 80 | 72 | 88 | 18 | 34 | 7 |
| Y2 | 120 | 100 | 60 | 54 | 66 | 20 | 34 | 6.5 |
| Y3 | 100 | 200 | 40 | 36 | 44 | 22 | 34 | 6 |
| Scenario | pH (total scale) | Carbonate (micromol/kg) | Calcification (mg CaCO3/day) |
|---|---|---|---|
| A | 8.1 | 200 | 1 |
| B | 7.8 | 120 | 0.7 |
| C | 7.5 | 60 | 0.4 |
Worked model
CPUE changes from 100/50 = 2 to 100/200 = 0.5 tonnes/boat-day: a 75% decline despite zero net catch change. The survey index halves, supporting concern but not proving a cause or a stock size. From pH 8.1 to 7.8, the hydrogen-ion ratio is 10^(8.1−7.8) = 1.995262, nearly twofold; carbonate falls 40% and calcification 30% in the supplied scenarios.
Numerical calibration
- 2 tonnes/boat-day
- 0.5 tonnes/boat-day
- 0 % Y1 to Y3 catch
- -75 % Y1 to Y3 CPUE
- -50 % Y1 to Y3 survey index
- 0.125 relative abundance ratio if catchability doubles
- 1.995262 pH-derived relative hydrogen-ion ratio, A to B
- -40 % carbonate, A to B
- -30 % calcification, A to B
Attempt the assigned level
Try the tasks before reading the calibration. These are practice answers, not a secure examination; use a new dataset or changed assumption for the assessed transfer.
Foundation
- Calculate all three CPUE values and compare the first and last catch and survey index.
- Trace CO2 → hydrogen ions/bicarbonate → carbonate availability → calcification; distinguish this from heat-related bleaching.
Check after your attempt
- CPUE is 2, 1.2 and 0.5 tonnes/boat-day. Catch returns to 100 tonnes/year while the index changes from 80 to 40; constant catch does not mean constant population.
- Added CO2 generally increases hydrogen ions and reduces carbonate availability under comparable conditions. Bleaching involves stress-related symbiont or pigment loss; it is not synonymous with shell dissolution or certain death.
High-school core: typically grades 9-10
- Calculate endpoint percent changes in catch, effort, CPUE, survey index, carbonate and calcification.
- Recommend one fishery indicator and one water-quality action, citing the relevant NOAA source and limiting what these data prove.
Check after your attempt
- Catch 0%; effort +300%; CPUE −75%; survey index −50%; A-to-B carbonate −40%; calcification −30%. Each percent uses its own initial denominator.
- A standardized age/recruitment-aware survey can test a fishery trend; reducing nutrient runoff targets oxygen demand. These synthetic patterns do not establish overfishing, a sustainable catch limit, or the effect of a protected area.
Honors extension: typically grades 11-12
- Calculate the pH-derived hydrogen-ion ratio and bound the Y3/Y1 survey-index ratio using the given lower/upper bounds.
- If catchability doubles from Y1 to Y3, compute the relative abundance ratio implied by the simple CPUE = q×abundance model; explain why neither assumption validates an assessment.
Check after your attempt
- The ion ratio is 1.995262. Survey ratios range from 36/88 = 0.4091 to 44/72 = 0.6111 under conservative endpoint bounds; these are not a fitted assessment confidence interval.
- CPUE ratio is 0.25; dividing by a catchability ratio of 2 gives 0.125, versus 0.25 with constant q. Neither equals the survey ratio of 0.50: differing catchability, selectivity or coverage need investigation. Unknown gear efficiency, targeting, mortality and recruitment prevent using either as a validated stock estimate.
History, reading, and writing connection
Write a 200-word public briefing comparing NOAA’s fish-stock assessment definition with its account of standardized survey evidence. Include the synthetic CPUE and survey trends, one uncertainty bound and one alternative cause. Add the acidification source to explain why a protected area is not a substitute for CO2 mitigation. A checked response argues for further evidence and a targeted action rather than declaring a proven collapse.
Write in your own words or use an approved accessible equivalent. Cite a specific assigned section or figure, identify its evidence, and state one limitation or counterargument. Use the AI practice contract only for permitted coaching, never to invent observations or write the assessed response.
Transfer to a new case
After a regulation change, catch halves and effort halves while the standardized survey index stays similar. Does the catch decline alone demonstrate a halving of the stock?
Calibration: No. CPUE is unchanged, effort changed and the independent index is similar. Detection, catchability, discards and biology still need checking before a stock conclusion.
Evidence to retain
Retain trend plots, denominators, effort and catchability sensitivity, survey bounds, the chemical mechanism and the cited briefing. This inland synthetic exercise is not an operational stock assessment, water-treatment instruction, field credential or complete AP Biology preparation.
Record units, calculations, source/date, uncertainty, and what is measured versus inferred. A simulation or supplied dataset must stay labeled as such. The inland supplied-data pathway is available in every unit with equivalent analysis evidence, not a performed field/practical credential. Optional observations require instructor and site approval from a dry, accessible location. No diving, breath-holding, marine-mammal physiology imitation, boats, wading, hazardous tidal sites, handling wild animals, unapproved collection, ingestion, unknown-microbe culture, or hatchery experiments.
Return to all eight learning pathways. Print this unit page for the student lessons; the linked five-page packet remains the separate assessment companion.
Unit mastery rubric
| Criterion | Developing | Proficient | Mastery |
|---|---|---|---|
| Fisheries, stocks & effort | Equates catch with population size. | Divides by effort but assumes constant catchability. | Distinguishes catch, stock and CPUE; quantifies trends with effort, survey context, recruitment and catchability limits. |
| Pollution & oxygen stress | Treats pollution only as visible litter. | Names pathways without a biological mechanism. | Traces plastics, oil and nutrient runoff to mechanisms including microbial oxygen demand; separates exposure indicators from demonstrated harm. |
| Climate & carbonate chemistry | Confuses acidification with acid rain or bleaching. | Describes pH change but not carbonate or logarithmic scale. | Explains CO2/bicarbonate/carbonate mechanisms, calculates pH and response comparisons, and distinguishes warming, bleaching and mortality. |
| Conservation & evidence | Promises recovery from any protected area. | Names a tool without its target or limits. | Matches protection, restoration and policy to pressures; considers connectivity, compliance and uncertainty without promising sustainable yield. |
| Lab technique (data case study) | Uses headlines or invented observations. | Plots data without effort, units or limitations. | Defends calculations, source provenance and sensitivity from supplied records; does not label a synthetic case a validated stock assessment. |
| Integration (cross-domain) | Makes no supported connection between the source and the science. | Uses the source but needs help connecting evidence, writing, or limitations to the science. | Independently connects History, Reading, and Writing using a cited source, appropriate evidence, a limitation, and a scientific explanation. |
Integration is reported separately and cannot lower the science grade or block a science demonstration pass. Science and practical criteria determine that pass. Use the integration guide's evidence checklist for the separately reported criterion.
Catch returns to 100 tonnes/year, but CPUE declines 75% as effort quadruples; the independent index declines 50%. That is a concern, not proof of overfishing. The 0.3-unit pH decrease nearly doubles hydrogen ions on the stated scale.
Do not claim a synthetic catch curve validates a stock assessment. Keep acidification, thermal bleaching and oxygen loss as distinct, potentially interacting mechanisms.
Retain trend plots, denominators, effort and catchability sensitivity, survey bounds, the chemical mechanism and the cited briefing. This inland synthetic exercise is not an operational stock assessment, water-treatment instruction, field credential or complete AP Biology preparation. Integration is reported separately and cannot lower the science grade or block a science demonstration pass. Science and practical criteria determine that pass.
A 5-page clipboard packet — unit overview, key terms, the mastery rubric, anchor examples, and a score sheet you can print and grade against.