Unit 02 · Cell Structure & Function
Use the cell structure & function learning pathway for original readings, models, supplied data, checked practice and fresh transfer. The five science criteria stay distinct from integration; a paper/data alternative does not certify an unobserved technique.
Student learning: Cell Structure & Function
Choose the level by readiness, not age alone, and record it before instruction. Foundation, core, and honors tasks are study pathways, not an AP course or a promise of college credit. The instructor retains practical assessment and the published science rubric; integration is reported separately.
Prerequisites: Unit 1 molecules, area/volume, length conversion and percent change. Honors adds pressure, molarity, Kelvin and a stated ideal water-potential model.
Suggested sequence: read and discuss the explanation; attempt the worked model; analyze the data at your selected level; check the answers; then complete the source-linked response and a fresh transfer question. These activities supplement, not replace, supervised practical work and the full-year schedule.
Assigned reading and focus
- OpenStax Biology 2e (2018), 4.1 Studying Cells. [cell-geometry] Compare microscopy magnification and resolution. Use a published scale bar rather than estimating a specimen size from screen size.
- OpenStax Biology 2e (2018), 4.2 Prokaryotic Cells. [cell-geometry] Compare the cell envelope, nucleoid and ribosomes with the eukaryotic cell drawing; prokaryotes are not less-evolved versions of modern eukaryotes.
- OpenStax Biology 2e (2018), 4.3 Eukaryotic Cells. [cell-geometry] Study nucleus, mitochondria and chloroplasts. Compare internal membranes and the endosymbiosis evidence.
- OpenStax Biology 2e (2018), 4.4 The Endomembrane System and Proteins. [cell-geometry] Trace a secreted protein from ribosome and rough ER through Golgi and vesicle; distinguish a model from an observed organelle.
- NobelPrize.org: The Nobel Prize in Chemistry 2014. [cell-geometry] Read the 2014 recognition of Betzig, Hell and Moerner for super-resolved fluorescence microscopy. Explain why improved resolution differs from enlarging a print; do not claim our supplied scale record uses that method.
- OpenStax Biology 2e (2018), 5.1 Components and Structure. [membrane-model] Study the fluid-mosaic model, phospholipid orientation and membrane-protein roles.
- OpenStax Biology 2e (2018), 5.2 Passive Transport. [membrane-model] Read diffusion, facilitated diffusion and tonicity. Separate solute permeability from water movement.
- OpenStax Biology 2e (2018), 5.3 Active Transport. [membrane-model] Read primary and secondary active transport; identify the original energy source in a coupled gradient.
- OpenStax Biology 2e (2018), 5.4 Bulk Transport. [membrane-model] Compare endocytosis and exocytosis with transport through channels; cargo is moved in vesicles, not through a pore.
- OpenStax Biology 2e (2018), 4.3 Eukaryotic Cells. [cell-wall-pressure] Read The Cell Wall and the central vacuole discussion. Compare support outside the membrane with selective passage across the membrane.
- OpenStax Biology 2e (2018), 5.2 Passive Transport. [cell-wall-pressure] Read osmosis and tonicity in walled and unwalled cells. A rigid wall can resist expansion but does not eliminate an osmotic gradient.
- OpenStax Biology 2e (2018), 41.1 Osmoregulation and Osmotic Balance. [organism-osmoregulation] Read osmotic balance, electrolyte transport and osmoregulators. Distinguish a maintained internal environment from simply matching external salinity.
Learn the science
[cell-geometry] For a cube of side L, surface area is 6L², volume is L³ and area/volume is 6/L. A larger cube has more total surface yet less surface per unit volume. Diffusion distance also increases. Real cells use different shapes, folds and transport systems; the geometry is a model rather than a universal maximum cell size.
[cell-geometry] Magnification enlarges an image; resolution separates close features. A scale bar represents a known distance at the same image enlargement. A nucleus may be visible in a stained light micrograph, but membrane channels and many ribosomes are not resolved; never copy every organelle from a diagram into an observation record.
[cell-geometry] Both prokaryotic and eukaryotic cells have membranes, DNA and ribosomes. Eukaryotic nuclei and internal compartments separate reactions, concentrate enzymes and establish gradients. Secreted proteins can travel ribosome → rough ER → Golgi → vesicle → plasma membrane. Cells share ancestry, not a ladder of current organisms becoming “higher” organisms.
[cell-geometry] Double membranes, division of organelles and bacterial relationships of mitochondrial/chloroplast genes support an endosymbiotic origin. A membrane alone is not decisive; compare independent evidence and alternatives. Mitochondrial and chloroplast ribosomes differ from cytosolic ones, but not all organelle ribosomes share one sedimentation value.
[membrane-model] Small nonpolar molecules cross the lipid bilayer more easily than ions or large polar solutes. Channels and carriers can allow downhill facilitated diffusion without directly consuming ATP. Primary active pumps couple transport to energy use; secondary transport can use a gradient established by another pump. Vesicular endocytosis/exocytosis changes membrane boundaries and is not simple diffusion.
[membrane-model] Osmosis is net water movement through a selectively permeable boundary. Tonicity depends on nonpenetrating solutes and cell response, not just total solute count. The synthetic mass experiment uses equal starting mass and nonpenetrating external solute, but plant tissues also develop pressure and have multiple compartments.
[membrane-model] For the honors ideal dilute model, Ψ = Ψs + Ψp and Ψs = −iCRT. Use i = 1 for the stated nonionizing solute, R = 0.00831 L·MPa/(mol·K), T = 298 K and molarity in mol/L. Water moves from higher to lower total water potential, not always toward the larger concentration if pressure differs.
[membrane-model] The modeled cell has C = 0.3 mol/L and pressure 0.4 MPa; its Ψ is −0.342914 MPa. The open bath at 0.2 mol/L has Ψ = −0.495276 MPa. Water leaves the cell in this example. The zero-mass interpolation from a different tissue dataset is not automatically a direct cytosolic concentration measurement.
[cell-wall-pressure] A cell wall provides mechanical support and limits expansion as pressure builds. The plasma membrane remains the selectively permeable boundary. A cell wall is not an impermeable substitute for membrane channels and transporters.
[cell-wall-pressure] For these small-cell states only, total water potential is solute potential plus pressure potential, in MPa; gravity and matric effects are omitted. Water tends toward lower total potential. The initial states do not specify final volume or the changing solute concentration during flow.
[cell-wall-pressure] Equal total potentials can occur with unlike solute concentrations because positive turgor pressure offsets a negative solute potential. Hypertonic surroundings can still withdraw water from a walled cell; plasmolysis is not prevented merely by having a wall.
[organism-osmoregulation] Osmoregulation maintains water and ion conditions compatible with cell function. Freshwater teleosts typically face passive water gain and ion loss; marine teleosts typically face passive water loss and salt gain. These examples do not describe every fish, shark or marine invertebrate.
[organism-osmoregulation] Regulated drinking, urine and ion transport can balance net flux while internal and external concentrations remain different. Active ion transport requires energy, and a balanced water ledger does not by itself demonstrate balanced sodium or every other solute.
[organism-osmoregulation] The budgets are teaching models. Their normalizations, period and boundary must be preserved; changes in one output produce temporary imbalance only if the other stated terms are held fixed.

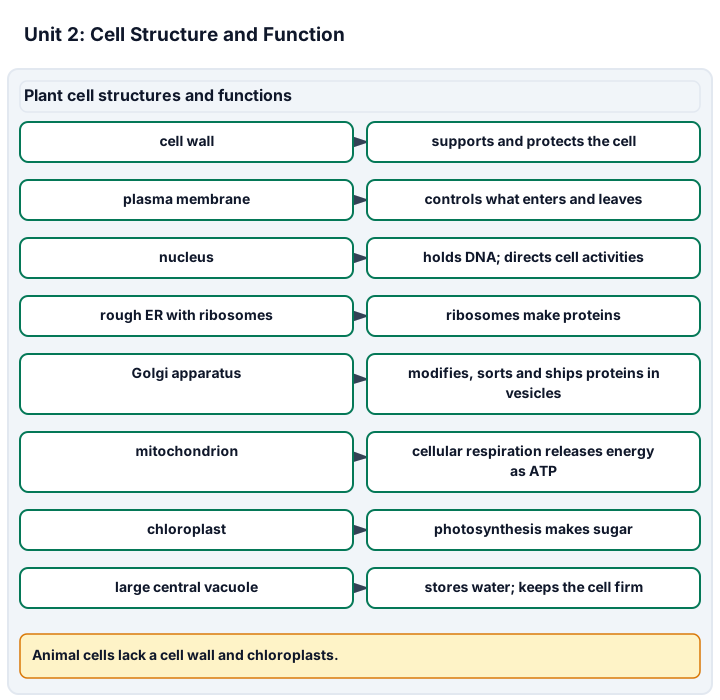
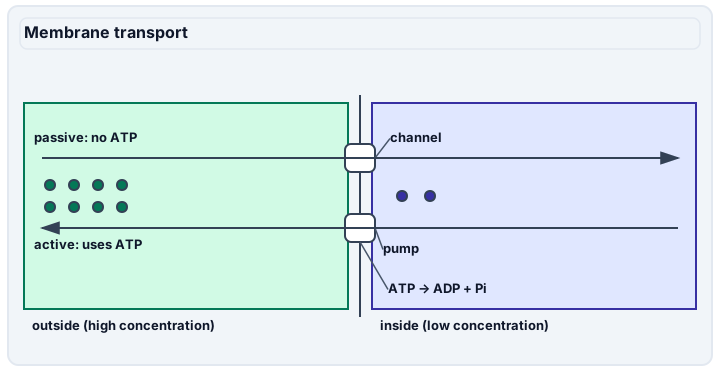
Diagram description
Plant cell structures and functions are shown as eight rows: cell wall supports and protects the cell; plasma membrane controls what enters and leaves; nucleus holds DNA and directs cell activities; rough ER with ribosomes makes proteins; Golgi apparatus modifies, sorts and ships proteins in vesicles; mitochondrion releases energy as ATP through cellular respiration; chloroplast makes sugar by photosynthesis; large central vacuole stores water and keeps the cell firm. Animal cells lack a cell wall and chloroplasts. Membrane transport shows passive transport through a channel without ATP and active transport through a pump using ATP.
Data, provenance, and assumptions
| Cube | Side length |
|---|---|
| Small | 10 |
| Large | 20 |
| Printed bar (mm) | Real bar (micrometres) | Printed cell (mm) |
|---|---|---|
| 40 | 100 | 8 |
| Evidence | Mitochondria/chloroplasts | Interpretation limit |
|---|---|---|
| Boundaries | Two surrounding membranes | Membranes alone do not establish ancestry |
| Information | Genes with bacterial evolutionary relationships | Needs sequence comparison, not just circular shape |
| Continuity | Existing organelles divide | Not proof of independent free-living capability |
| Bath (mol/L) | Initial mass (g) | Final 1 | Final 2 | Final 3 |
|---|---|---|---|---|
| 0 | 10 | 11 | 11.2 | 10.8 |
| 0.2 | 10 | 10.4 | 10.6 | 10.2 |
| 0.4 | 10 | 9.6 | 9.8 | 9.4 |
| 0.6 | 10 | 9 | 9.2 | 8.8 |
| Cargo and route | Gradient or energy condition |
|---|---|
| Oxygen through lipid | Downhill |
| Ion through open channel | Downhill electrochemical gradient |
| Ion through ATP pump | Uphill, coupled to ATP hydrolysis |
| Large cargo in vesicle | Membrane remodeling and energy required |
| Model state | Cell solute potential (MPa) | Cell pressure potential (MPa) | Bath total potential (MPa) |
|---|---|---|---|
| Walled, turgid | -0.7 | 0.7 | 0 |
| No wall, initial | -0.7 | 0 | 0 |
| Walled, hypertonic bath | -0.7 | 0.2 | -1 |
| Model | Internal osmolarity (mOsm/L) | External osmolarity (mOsm/L) |
|---|---|---|
| Freshwater | 300 | 5 |
| Marine | 350 | 1000 |
| Model | Passive gain | Drinking | Urine | Other loss |
|---|---|---|---|---|
| Freshwater | 12 | 0 | 10 | 2 |
| Marine | 0 | 10 | 1 | 9 |
Worked model
[cell-geometry] The large cube has area 2400 µm² and volume 8000 µm³, giving 0.3 µm⁻¹, half the smaller cube’s 0.6 µm⁻¹. The printed cell represents 8/40 × 100 = 20 µm. This calculation does not reveal invisible organelles or show that a microscope was focused. [membrane-model] Mean percent mass changes are +10%, +4%, −4% and −10% across the four baths. A straight interpolation between 0.2 and 0.4 mol/L estimates zero change at 0.3 mol/L; this assumes a locally linear relation, not a global law. Pressure-aware water potential must be computed separately for the stated cell and bath. [cell-wall-pressure] The turgid state has total potential -0.7 + 0.7 = 0 MPa, equal to its bath. The initially unwalled state is -0.7 MPa, so water tends inward. The hypertonic-bath state is -0.5 MPa inside versus -1.0 outside, an outward driving difference of 0.5 MPa. Those differences do not alone give a flow rate. [organism-osmoregulation] Freshwater balance is 12 + 0 - 10 - 2 = 0 mL/day; marine balance is 0 + 10 - 1 - 9 = 0. Neither zero implies equal internal/external osmolarity. If freshwater urine falls to 5 with the other values fixed, net accumulation is 5 mL/day.
Numerical calibration
- 0.3 micrometres⁻¹
- 20 micrometres
- 0.3 mol/L, local interpolation
- -0.342914 MPa
- -0.495276 MPa
- 0 MPa
- -0.7 MPa
- 0.5 MPa, cell minus bath
- 0.4 MPa required under the transfer model
- 0 mL/day
- 0 mL/day
- 5 mL/day under fixed other terms
- -4 model ion units/day
Attempt the assigned level
Try the tasks before reading the calibration. These are practice answers, not a secure examination; use a new dataset or changed assumption for the assessed transfer.
Foundation: typically grades 7-8
- [cell-geometry] Find the reference cell’s size from image-scale and label nucleus, cytoplasm and membrane on the assigned cell drawing. State which labels would need actual visible evidence in a microscope image. Evidence: science criteria 1, 3, 4; AP-connection objectives 2.1.A, 2.2.A (selected task connection, not full objective mastery).
- [membrane-model] Calculate the mean final mass for each bath in osmosis-records, describe the direction of change, and classify oxygen movement versus vesicle cargo in transport-models. Evidence: science criteria 2, 5; AP-connection objectives 2.3.A, 2.4.A, 2.5.A, 2.8.A (selected task connection, not full objective mastery).
- [cell-wall-pressure] Identify which model is initially balanced and which gains or loses water. Explain one job of the cell wall using the supplied states rather than a plant-cell slogan. Evidence: science criteria 2, 5; AP-connection objectives 2.4.B (selected task connection, not full objective mastery).
- [organism-osmoregulation] Compare each internal/external concentration and calculate inputs minus outputs for both water ledgers. Does a zero water balance mean the two concentrations are equal? Evidence: science criteria 2, 5; AP-connection objectives 2.7.B (selected task connection, not full objective mastery).
Check after your attempt
- [cell-geometry] The cell width is 20 micrometres. A nucleus or boundary is recorded only when resolved in the actual field. Ribosomes and channels on an explanatory drawing are model labels, not automatic light-microscope observations.
- [membrane-model] Means are 11, 10.4, 9.6 and 9 g. The first two groups gain mass and the last two lose it. Oxygen can diffuse through lipid; large vesicle cargo uses membrane remodeling rather than a dissolved molecule simply crossing lipid.
- [cell-wall-pressure] The turgid model is balanced; water initially enters the unwalled model and leaves the hypertonic-bath model. The wall can support pressure and resist excessive expansion, but does not stop every water movement.
- [organism-osmoregulation] The freshwater internal concentration is higher and the marine internal concentration lower than the respective environment. Both net water balances are zero, yet the concentrations remain different in the supplied model.
High-school core: typically grades 9-10
- [cell-geometry] Calculate area, volume and area/volume for both cell-cubes. Trace a secreted protein through cell compartments and explain why a prokaryote can make proteins without a membrane-bound nucleus. Evidence: science criteria 1, 3, 5; AP-connection objectives 2.1.A, 2.2.A, 2.9.A, 2.9.B (selected task connection, not full objective mastery).
- [membrane-model] Plot mean percent mass change against bath concentration, estimate zero change between the middle treatments, and explain the different roles of a channel and an ATP-driven pump. Evidence: science criteria 2, 5; AP-connection objectives 2.3.A, 2.3.B, 2.4.A, 2.5.B, 2.6.A, 2.7.A, 2.8.A (selected task connection, not full objective mastery).
- [cell-wall-pressure] Calculate all cell totals and the outward potential difference. Explain why the membrane and cell wall cannot be assigned the same selective transport function. Evidence: science criteria 2, 5; AP-connection objectives 2.4.B (selected task connection, not full objective mastery).
- [organism-osmoregulation] Explain how the two ledgers can balance while ion gradients persist. Predict the freshwater water change if urine becomes 5 mL/day with other terms fixed. Evidence: science criteria 2, 5; AP-connection objectives 2.7.B (selected task connection, not full objective mastery).
Check after your attempt
- [cell-geometry] Areas are 600 and 2400 µm²; volumes 1000 and 8000 µm³; ratios 0.6 and 0.3 µm⁻¹. The route is ribosome/rough ER → Golgi → vesicle → cell surface. Prokaryotes have DNA, RNA and ribosomes; absence of a nucleus does not mean absence of information or protein synthesis.
- [membrane-model] The mean changes are +10%, +4%, −4%, −10%; local linear interpolation gives 0.3 mol/L. Channels allow downhill facilitated diffusion; ATP-driven pumps can move cargo uphill by energy coupling. Phospholipid tails form the hydrophobic barrier while embedded proteins provide selective routes.
- [cell-wall-pressure] Totals are 0, -0.7 and -0.5 MPa. The outward difference is 0.5 MPa in the last row. Selective permeability belongs to the membrane and its components; the wall contributes support while allowing many small substances through.
- [organism-osmoregulation] The altered freshwater balance is +5 mL/day. Active ion transport and regulated excretion help maintain internal composition; a water budget alone cannot quantify the energetic cost or prove that every ion is balanced.
Honors extension: typically grades 11-12
- [cell-geometry] Use organelle-evidence to defend an endosymbiotic inference with two independent observations. Explain why increasing image size alone cannot test it, and why a surface-area argument does not set one maximum size for every cell. Evidence: science criteria 1, 3, 4, 5; AP-connection objectives 2.2.A, 2.9.B, 2.10.A (selected task connection, not full objective mastery).
- [membrane-model] Compute Ψ for the stated pressurized cell and open bath, predict water movement, and assess whether three strips taken from a single plant instead of different plants would support the same independence claim. Evidence: science criteria 2, 5; AP-connection objectives 2.7.A (selected task connection, not full objective mastery).
- [cell-wall-pressure] Explain why the table cannot determine final cell volume or water-flow rate. Name an additional property or evolving variable needed before predicting either. Evidence: science criteria 2, 5; AP-connection objectives 2.4.B (selected task connection, not full objective mastery).
- [organism-osmoregulation] Explain a possible consequence if an imbalance persisted and identify additional evidence needed to predict survival, without applying these values to real animal care. Evidence: science criteria 2, 5; AP-connection objectives 2.7.B (selected task connection, not full objective mastery).
Check after your attempt
- [cell-geometry] Bacterial gene relationships combined with organelle division and surrounding membranes support endosymbiosis more strongly than membrane count alone. Enlarging pixels adds no resolved molecular information. Shapes, folding, metabolic demand and active transport modify the geometry constraint, so the cube model is not a universal cell-size law.
- [membrane-model] Cell Ψ = −0.3 × 0.00831 × 298 + 0.4 = −0.342914 MPa; bath Ψ = −0.495276 MPa. Water moves out toward the lower total potential. Three strips from one plant are subsamples, not three independent plants; inference to plants would require independent plant replication.
- [cell-wall-pressure] Concentration changes with water movement, and membrane permeability, wall mechanics and available volume also matter. The initial pressure/potential values describe directions and a balance, not a complete dynamic model.
- [organism-osmoregulation] Persistent accumulation could cause swelling and impaired cell function; sustained loss could reduce volume. Survival depends on compensatory responses, body size, time and ion conditions, none of which can be diagnosed from this small synthetic ledger alone.
History, reading, and writing connection
Read the official 2014 Nobel chemistry summary and OpenStax’s microscope figures. Explain what improved resolution means and how it differs from enlarging an image. Identify the historical recognition, cite the source and state why the synthetic printed-scale record neither uses nor demonstrates super-resolution microscopy.
Write in your own words or use an approved accessible equivalent. Cite a specific assigned section or figure, identify its evidence, and state one limitation or counterargument. Use the AI practice contract only for permitted coaching, never to invent observations or write the assessed response.
Transfer to a new case
[cell-geometry] A fresh reference image has a 30 mm printed bar representing 75 micrometres; an object spans 12 mm. A different cube cell has side 5 micrometres. Find both object size and area/volume, and state what the image cannot certify. [membrane-model] Fresh synthetic treatments at 0.1 and 0.3 mol/L give mean mass changes of +6% and −2%. Interpolate zero change. If a solute now crosses the membrane freely, does that concentration difference necessarily maintain tonicity? [cell-wall-pressure] In a new walled-cell model, solute potential is -0.7 MPa and bath total potential is -0.3 MPa. What pressure would balance the totals, and does that value establish a final cell volume? [organism-osmoregulation] A separate fictional ion ledger has uptake of 2 units/day and loss of 6 units/day. What is its net change, and can a zero water balance be used to dismiss that change?
Calibration: [cell-geometry] The object is 30 micrometres wide and the cube ratio is 6/5 = 1.2 micrometres⁻¹. Neither printed-scale arithmetic nor a reference image certifies slide preparation, focusing, specimen handling or resolution beyond the source image. [membrane-model] Zero change is 0.1 + 6/(6 + 2) × 0.2 = 0.25 mol/L under the local-linear assumption. A freely penetrating solute can equilibrate and need not maintain the same sustained osmotic effect; the nonpenetrating-solute assumption has changed. [cell-wall-pressure] A pressure of 0.4 MPa gives -0.7 + 0.4 = -0.3 MPa. This algebraic condition does not establish the final volume; concentration, membrane and wall properties would need their own model. [organism-osmoregulation] The net ion change is -4 units/day. A zero water balance does not establish ion balance; the organism would need compensating ion transport or another source to maintain that ion pool.
Evidence to retain
[cell-geometry] Science criteria 1, 3 and 5: organelle function and compartment/ancestry reasoning; criterion 4: calibrated image interpretation, with focusing/handling evidence retained separately. [membrane-model] Science criterion 2: transport and pressure-aware predictions; criterion 5: membrane structure/function. Retain careful data recording and stated model limits; this paper transport task does not assess microscopy. [cell-wall-pressure] Science criteria 2 and 5: signed potential calculations, membrane-versus-wall explanation, transfer balance and an explicit model limitation. [organism-osmoregulation] Science criteria 2 and 5: gradient interpretation, daily water/ion balances, energy-dependent transport explanation and qualified survival inference.
Record units, calculations, source/date, uncertainty, and what is measured versus inferred. A simulation or supplied dataset must stay labeled as such. These are public, nonsecure paper/data practice activities, not performed laboratory work. No culture of unknown microbes, human biological samples, medical or genetic personal disclosures, unsafe chemicals, or DNA manipulation instructions are authorized. Use supplied data, approved reference images, or a preapproved non-destructive observation. An instructor must review safety, accessibility and the exact practical contract before any physical activity; a worksheet does not certify hands-on technique.
Return to all eight learning pathways. Print this unit page for the student lessons; the linked five-page packet remains the separate assessment companion.
Use the investigation design before assessment
Each linked design gives materials, controls, sampling, procedure, uncertainty and the required human practical/safety review. No worksheet certifies an unobserved technique.
Unit mastery rubric
| Criterion | Developing | Proficient | Mastery |
|---|---|---|---|
| Organelle identification & function | Labels structures without identifying their role. | Matches visible structures with a prompt. | Connects organelle and compartment structure to function, distinguishing resolved image evidence from diagram labels. |
| Membrane transport reasoning | Confuses solute movement, water movement and energy. | Uses gradients with some prompting. | Predicts passive, active and vesicular transport; interprets tonicity, water potential and organism water/ion balance. |
| Prokaryote / eukaryote distinction | Equates lack of a nucleus with lack of DNA. | Names cell types but overstates size rules. | Contrasts cell organization, shared features and compartment origins without a progress-ladder claim. |
| Microscopy of cells | Invents features or ignores image calibration. | Finds cells with assistance or incomplete scale reasoning. | Uses a scale bar and evidence-based identification; separately demonstrates approved focusing/handling or the agreed accessible practical. |
| Structure–function connection | Treats cell geometry as a memorized label. | Calculates a ratio with limited interpretation. | Explains how surface/volume, membranes, wall support and compartments constrain function, with model assumptions. |
| Integration (cross-domain) | Makes no supported connection between the source and the science. | Uses the source but needs help connecting evidence, writing, or limitations to the science. | Independently connects History, Reading, and Writing using a cited source, appropriate evidence, a limitation, and a scientific explanation. |
Integration is reported separately and cannot lower the science grade or block a science demonstration pass. Science and practical criteria determine that pass. Use the integration guide's evidence checklist for the separately reported criterion.
The large cube has area 2400 µm² and volume 8000 µm³, giving 0.3 µm⁻¹, half the smaller cube’s 0.6 µm⁻¹. The printed cell represents 8/40 × 100 = 20 µm. This calculation does not reveal invisible organelles or show that a microscope was focused.
“I completed the cell structure & function worksheet, so I have mastered every science and practical criterion.” Completion and public answers are not evidence of independent mastery or observed technique.
Agree the level and specific science/practical contract before instruction. Retain an independent first attempt, source interpretation, calculations and a fresh instructor variation or observation. Public worked answers are nonsecure practice, not a private examination.
A 5-page clipboard packet — unit overview, key terms, the mastery rubric, anchor examples, and a score sheet you can print and grade against.