Unit 05 · Plant Growth & Hormones
Study growth, tropisms, photoperiod, and interacting hormonal responses to the environment. Connect normal growth and apical dominance to abiotic stress and biotic defense without assuming one signal explains every response. The learning pathway includes a 14-day normal-care observation plan and a separately labeled synthetic dataset; no deliberate infection, damage, or chemical treatment is required.
Student learning: Follow growth over time and explain stress and defense without overclaiming
Choose the level by readiness, not age alone, and record it before instruction. Foundation, core, and honors tasks are study pathways, not an AP course or a promise of college credit. The instructor retains practical assessment and the published science rubric; integration is reported separately.
Prerequisites: Plant organs, signed changes, repeated measurements, normal plant care, and the distinction between a measured response and an inferred signal.
Suggested sequence: read and discuss the explanation; attempt the worked model; analyze the data at your selected level; check the answers; then complete the source-linked response and a fresh transfer question. These activities supplement, not replace, supervised practical work and the full-year schedule.
Assigned reading and focus
- OpenStax Biology 2e, 30.6: Plant Sensory Systems and Responses. Read the hormone summaries, abscisic acid, nontraditional hormones, and defenses. Use these as mechanism references, not as instructions to apply hormones or provoke damage.
- OpenStax Biology 2e, 30.4: Leaves. Review leaf form and stomata so the observation protocol uses the same measurement definitions on every date.
Learn the science
Auxins, cytokinins, gibberellins, ethylene, and abscisic acid participate in interacting regulatory systems. Response depends on tissue, developmental stage, concentration, and other signals; a single hormone is not a universal switch for all growth.
Phototropism and gravitropism involve differential growth and signaling. Touch responses include several mechanisms, so every thigmotropic response should not be reduced to the same auxin-redistribution story. Apical dominance also involves interactions among signals and resources, not just a label on one hormone.
Abiotic stresses include water limitation, temperature, salinity, and flooding. ABA participates in water-stress responses including stomatal regulation. Closing stomata can conserve water while restricting CO2 entry; a visible response alone does not measure an ABA concentration.
Biotic challenges include herbivores and pathogens. Cell walls, cuticles, structural traits, and inducible chemical responses contribute to defense. Jasmonate often participates in wound/herbivore responses and salicylic-acid signaling in particular pathogen responses; these systems interact and are not perfectly exclusive categories.
Photoperiod, temperature, and water conditions influence flowering and dormancy in species-dependent ways. Not every plant is controlled by the same day-length rule. The normal-care study below observes growth; it does not intentionally impose drought, damage, or infection.
Each plant is a biological observation unit. Three dates from eight plants are not 24 independent plants. Height change is not the same as biomass production, and an observed time trend does not identify a particular hormone or prove a treatment effect.

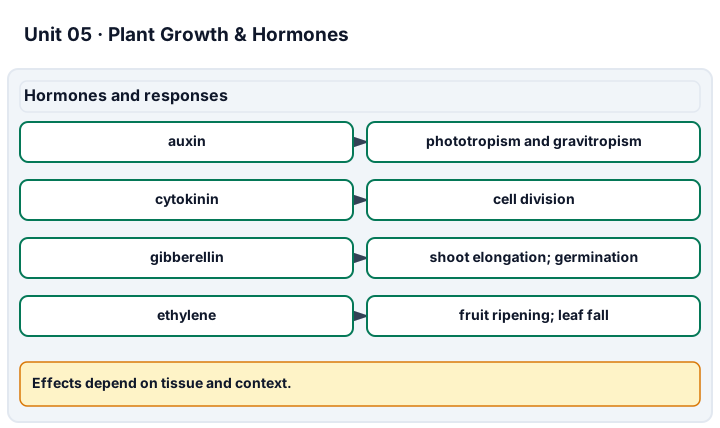
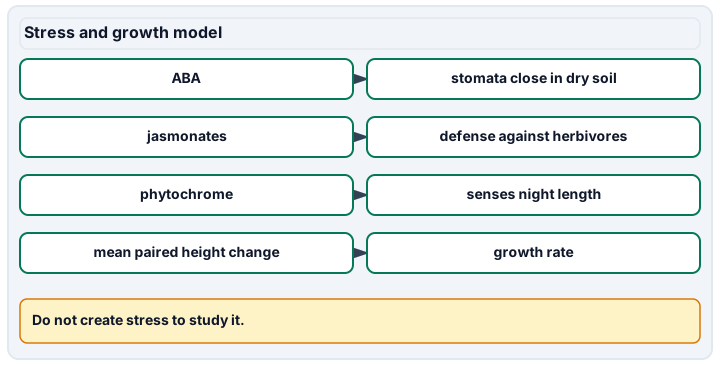
Diagram description
Auxin, cytokinin, gibberellin, ethylene, ABA, jasmonates, and phytochrome are linked to specific response categories while emphasizing tissue and context. Growth rate is computed from paired seedling heights over time, not from a single plant or a required result.
Data, provenance, and assumptions
| Plant ID | Day 0 height (mm) | Day 7 height (mm) | Day 14 height (mm) |
|---|---|---|---|
| P1 | 20 | 34 | 50 |
| P2 | 22 | 36 | 52 |
| P3 | 18 | 32 | 47 |
| P4 | 21 | 34 | 48 |
| P5 | 19 | 33 | 49 |
| P6 | 20 | 35 | 50 |
| P7 | 23 | 37 | 54 |
| P8 | 17 | 31 | 46 |
| Condition | Open stomata (%) | Water loss (mL/day) |
|---|---|---|
| Normal water supply | 80 | 4 |
| Water-limited model | 30 | 2 |
14-day normal-care observational investigation
Scope and safety: Use eight healthy, non-toxic nursery seedlings of one named variety in separate containers, approved by the instructor or supervising adult. Do not inoculate, culture microbes, wound plants, impose drought, or apply hormones or pesticides. Do not taste study plants. Follow supplier handling guidance, keep soil/media dust controlled by an adult, wash hands, and stop handling any moldy or diseased material until the adult decides safe disposal. The supplied dataset is an alternative for analysis; it does not certify hands-on plant care.
Materials and preparation
- Eight separately potted seedlings, labels P1-P8, a tray, a metric ruler, a water measure, and a dated notebook.
- The instructor records the species/variety, container/media details, and supplier-approved normal light, temperature, and watering plan before Day 0. Do not improvise a new care treatment.
- Optional photos must exclude faces, addresses, and other identifying information. A supplied image series or the synthetic data can support an accessible analysis route.
Procedure and schedule
- Before Day 0, label each plant ID, check the approved normal-care plan, and define height as substrate surface to the same shoot-tip landmark. Distinguish true leaves from cotyledons when counting.
- On Day 0, assign positions by a shuffled label order within the approved location. Record height to the ruler-supported precision, true-leaf count, and condition. Note that same-variety seedlings are not necessarily genetic clones.
- Keep normal care through the study. Record watering amounts and times, position changes, unusual light/temperature events, and visible condition daily. Do not change conditions to obtain a desired result.
- On Day 7, repeat height and leaf counts at approximately the same time of day and with the same landmarks and method. If positions are rotated to reduce edge effects, record the rotation.
- On Day 14, repeat the measurements and retain all plant records. Mark missing, damaged, or dead observations explicitly; do not invent values, silently remove a plant, or enter zero for an unknown height.
- Plot each plant through time and calculate the mean at each date with the number of plants contributing. For mean change, identify the plants with paired starting and ending readings rather than mixing different cohorts silently.
- Write a conclusion about this cohort, with measurement uncertainty and environmental limitations. If an instructor later approves a controlled comparison, plan independent treatment replicates and random assignment; the current normal-care record alone is not that experiment.
Record: Use columns for plant ID, date/day, height and unit, true-leaf count, condition, watering/care events, position, and missing-value reason. Retain the original readings and corrections. Submit the normal-care log separately from any supplied synthetic practice analysis.
Worked model
The synthetic starting mean is 20 mm and the Day 14 mean is 49.5 mm. Mean paired height gain is 29.5 mm over 14 days, about 2.11 mm/day. This is an average height-change rate for eight plants, not a biomass growth rate or 24 independent replicates.
Numerical calibration
- 49.5 mm
- 2.11 mm/day, rounded cohort mean
- 50 percent under the supplied model
Attempt the assigned level
Try the tasks before reading the calibration. These are practice answers, not a secure examination; use a new dataset or changed assumption for the assessed transfer.
Foundation
- Plot at least two plants and calculate their height changes. Identify the largest final height.
- Explain one abiotic and one biotic challenge, without creating them in a live investigation.
Check after your attempt
- For example, P1 gains 30 mm and P2 gains 30 mm; P7 finishes tallest at 54 mm.
- Water limitation is abiotic; a herbivore or pathogen is biotic. The data task does not require exposing plants to either.
High-school core: typically grades 9-10
- Calculate the Day 14 mean and mean paired height-change rate.
- Calculate the relative change in water loss in the stress table and explain the conservation/CO2-entry trade-off.
Check after your attempt
- Day 14 mean: 49.5 mm; mean rate: about 2.11 mm/day.
- Water loss decreases by 50%. Reduced stomatal opening can conserve water but can also restrict CO2 supply; the table does not identify a unique signal.
Honors extension: typically grades 11-12
- Compare the mean height-change rates over the first and second seven-day intervals.
- Explain how pseudoreplication, attrition, and unrecorded position effects could distort an inference; propose a better follow-up design on paper.
Check after your attempt
- The means are 20, 34, and 49.5 mm: rates of 2.00 and about 2.21 mm/day. The sparse record does not establish a universal linear growth law.
- Repeated dates are not new plants. Retain missing-value reasons, use paired records appropriately, and randomize independently replicated treatments in any future approved experiment.
History, reading, and writing connection
Connect the assigned plant-response reading to the observation record. Explain how a growth pattern can motivate a mechanistic hypothesis without directly measuring a hormone, and why honest records matter more than an expected curve.
Write in your own words or use an approved accessible equivalent. Cite a specific assigned section or figure, identify its evidence, and state one limitation or counterargument. Use the AI practice contract only for permitted coaching, never to invent observations or write the assessed response.
Transfer to a new case
One Day 14 value is missing. Can it be replaced with the group mean and counted as another measured plant?
Calibration: No. Mark it missing, report the contributing sample size, and distinguish any explicit imputation model from an actual observation.
Evidence to retain
Retain the care/measurement protocol, plant-level table, graphs, selected calculations, and a qualified mechanism discussion. An instructor evaluates practical care separately from analysis of provided data.
Record units, calculations, source/date, uncertainty, and what is measured versus inferred. A simulation or supplied dataset must stay labeled as such. Use the approved normal-care observation plan or supplied data. Do not culture unknown microbes, inoculate plants, apply hormones or pesticides, or eat study specimens.
Return to all eight learning pathways. Print this unit page for the student lessons; the linked five-page packet remains the separate assessment companion.
Unit mastery rubric
| Criterion | Developing | Proficient | Mastery |
|---|---|---|---|
| Plant hormones & their effects | Cannot name the plant hormones or thinks plants have none. | Names a hormone or two but confuses their effects. | Identifies auxins, gibberellins, cytokinins, ethylene, and abscisic acid and explains what each does — from stem elongation to fruit ripening to dormancy. |
| Tropisms (photo-, gravi-, thigmo-) | Cannot distinguish a directional response from growth alone. | Names a response but assumes the same mechanism in every tissue. | Explains light, gravity, and touch responses with appropriate tissue and signaling context, without reducing every response to one auxin rule. |
| Growth regulation, stress & defense | Confuses abiotic stress with infection or herbivory. | Names a signal but ignores interactions and trade-offs. | Explains apical dominance, ABA-related water responses, and jasmonate/salicylic defense examples, distinguishing observed effects from inferred signals. |
| Photoperiodism & germination control | Thinks day length has no effect on flowering. | Mentions photoperiod but cannot connect it to phytochrome or germination. | Explains how phytochrome lets a plant measure night length to time flowering and germination, and predicts a short- vs. long-day response. |
| Longitudinal observation & study design | Omits plant identities, dates, or the approved care plan. | Records growth but treats repeated dates as independent plants. | Follows an approved observation/design task, retains plant-level repeated measurements and missing records, and interprets change without claiming an unmeasured hormone cause. |
| Integration (cross-domain) | Makes no supported connection between the source and the science. | Uses the source but needs help connecting evidence, writing, or limitations to the science. | Independently connects History, Reading, and Writing using a cited source, appropriate evidence, a limitation, and a scientific explanation. |
Integration is reported separately and cannot lower the science grade or block a science demonstration pass. Science and practical criteria determine that pass. Use the integration guide's evidence checklist for the separately reported criterion.
“The record shows growth over 14 days, with eight plants measured repeatedly. The dates are not new biological replicates. The pattern can motivate a hormone hypothesis, but it does not measure that signal. I distinguish normal growth, water-stress responses, and defense against a biotic challenge.”
“Plants just grow up toward the sun because they like light. Hormones are an animal thing — I don’t think plants really move.”
Use the approved normal-care observation plan or the assigned data-analysis route, and explain the selected-level models and limitations. A supplied record supports analysis but does not certify practical plant care. The instructor separately observes any practical technique; no stress-induction, pathogen, or hormone-treatment procedure is required.
A 5-page clipboard packet — unit overview, key terms, the mastery rubric, anchor examples, and a score sheet you can print and grade against.