Unit 01 · Earth's Structure & Plate Tectonics
This unit builds from the inside of the planet outward: the layers of the Earth and what each is made of, how the rigid plates ride the slowly flowing asthenosphere, the three kinds of plate boundary and what each one builds or destroys, and the lines of evidence — matching coastlines and fossils, seafloor spreading, paleomagnetism — that turned Wegener's rejected idea into the organizing theory of all of geology. Mastery means you can read a plate-boundary map as a record of moving lithosphere, not a diagram to memorize.
Student learning: Measure relative plate motion and test a seismic location model
Choose the level by readiness, not age alone, and record it before instruction. Foundation, core, and honors tasks are study pathways, not an AP course or a promise of college credit. The instructor retains practical assessment and the published science rubric; integration is reported separately.
Prerequisites: Foundation: subtraction, coordinates and mm-to-cm conversion. Core: rates and scale factors. Honors: simultaneous circle equations and endpoint bounds. Readiness check: explain why 100 mm in 4 years is 25 mm/year, not 400. If rate or coordinate work is unfamiliar, complete foundation with a guide before the higher lane.
Suggested sequence: read and discuss the explanation; attempt the worked model; analyze the data at your selected level; check the answers; then complete the source-linked response and a fresh transfer question. These activities supplement, not replace, supervised practical work and the full-year schedule.
Assigned reading and focus
- USGS, This Dynamic Earth: Understanding Plate Motions. Read Divergent boundaries and Rates of motion. Contrast present-day geodetic measurements with the reconstruction of an ocean basin. The numbers below are independent teaching models, not an excerpt of a GPS station record.
Learn the science
Plate motion is relative to a reference frame. The first table reports the change in separation of two markers perpendicular to an idealized spreading ridge, not the distance traveled by either marker relative to Earth as a whole.
The interval-average rate is change in separation divided by elapsed time. One million mm equals one km. Only with the additional assumption of symmetric spreading does each side contribute half the separation rate.
Distance divided by present rate is a constant-rate model time, not a measured opening date. Magnetic stripes and dated rocks provide independent historical evidence. A motion rate cannot forecast an earthquake.
In the separate planar seismic model, S waves travel more slowly than P waves. The arrival delay is d/Vs - d/Vp, so d = delay/(1/Vs - 1/Vp). We assume a homogeneous medium, Vp = 8 km/s, Vs = 4 km/s, straight paths and zero depth; real Earth location work needs more information.

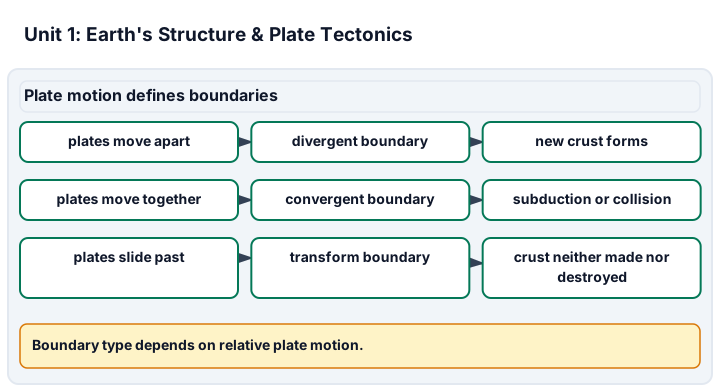
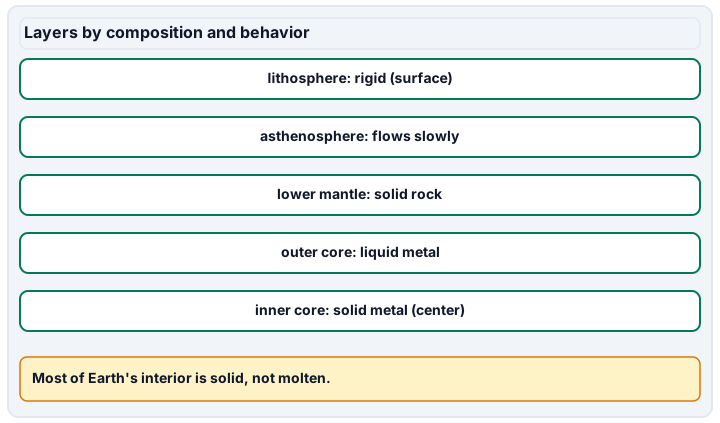
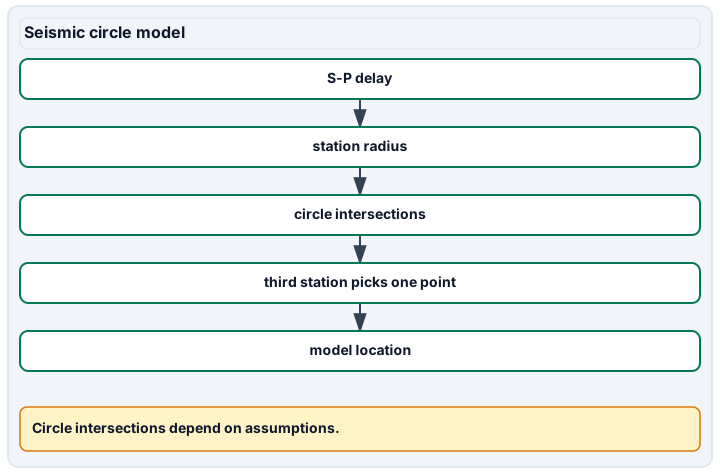
Diagram description
Plate-motion rows show motion first, then the boundary named from that motion, then the crustal result. The layers panel lists the rigid lithosphere at the surface, then the slowly flowing asthenosphere, solid lower mantle, liquid outer core and solid inner core at the center, top to bottom, with no arrows. The seismic panel shows S-P delay producing a radius; three station circles select one model location. Rate is not an age or a hazard forecast.
Data, provenance, and assumptions
| Elapsed time (years) | Separation change (mm) |
|---|---|
| 0 | 0 |
| 1 | 24 |
| 2 | 50 |
| 3 | 74 |
| 4 | 100 |
| Station | East (km) | North (km) | S-minus-P delay (s) |
|---|---|---|---|
| A | -30 | 0 | 6.25 |
| B | 30 | 0 | 6.25 |
| C | 0 | 60 | 2.5 |
Worked model
The separation rate is (100 - 0)/(4 - 0) = 25 mm/year = 2.5 cm/year. Under symmetric spreading one side contributes 12.5 mm/year. A hypothetical 1000 km opening at 25 mm/year takes 1000 x 1,000,000/25 = 40,000,000 years, or 40 Myr. For station A, 6.25/(1/4 - 1/8) = 50 km; this is a model distance, not a warning.
Numerical calibration
- 25 mm/year, relative separation
- 12.5 mm/year only for symmetric spreading
- 40 Myr, constant-rate scenario
- 50 km, model radius A
- 50 km, model radius B
- 20 km, model radius C
- 0 km east, nominal model intersection
- 40 km north, nominal model intersection
Attempt the assigned level
Try the tasks before reading the calibration. These are practice answers, not a secure examination; use a new dataset or changed assumption for the assessed transfer.
Foundation: typically grades 7-8
- Calculate the separation rate in mm/year and cm/year, showing the interval used.
- Calculate the model radius from each station and sketch the three circles on labeled km axes.
Check after your attempt
- The four-year average is 25 mm/year, or 2.5 cm/year; individual one-year intervals range from 24 to 26 mm/year.
- A and B have radius 50 km; C has radius 20 km. The circles meet at (0, 40) km in the nominal model.
High-school core: typically grades 9-10
- Assuming symmetric spreading, calculate each side's rate and the model time to open 1000 km. Explain why the time is not an observed basin age.
- Calculate the separation-rate bounds using 0 +/-2 mm and 100 +/-2 mm over exactly 4 years. Explain why small year-to-year changes need not show acceleration.
Check after your attempt
- Each side contributes 12.5 mm/year. The model time is 40 Myr; symmetry and an unchanged rate are assumptions, not historical observations.
- Minimum: (98 - 2)/4 = 24 mm/year. Maximum: (102 - (-2))/4 = 26 mm/year. The endpoint bounds do not establish that every annual fluctuation is real motion.
Honors extension: typically grades 11-12
- Solve (x + 30)^2 + y^2 = 50^2 and (x - 30)^2 + y^2 = 50^2, then use x^2 + (y - 60)^2 = 20^2 to choose the location. Explain the two-station ambiguity.
- Propagate the +/-0.1 s delay bound to distance using the stated speeds. Explain what would change if the source had depth or wave speeds varied.
Check after your attempt
- Subtracting the first two equations gives 120x = 0. Thus x = 0 and y = +/-40; station C selects y = 40 km. Two stations alone permit both intersections.
- The distance bound is +/-0.1/(1/4 - 1/8) = +/-0.8 km. The circles become bands; depth, station error and heterogeneous speeds prevent an exact real-world epicenter from this model.
History, reading, and writing connection
Using the USGS account, distinguish Wegener's evidence for former continental connections from later seafloor and geodetic measurements. Explain why a modern rate calculation alone cannot date Pangaea or identify the forces moving a plate. Cite the section and access date.
Write in your own words or use an approved accessible equivalent. Cite a specific assigned section or figure, identify its evidence, and state one limitation or counterargument. Use the AI practice contract only for permitted coaching, never to invent observations or write the assessed response.
Transfer to a new case
A fresh fictional record changes separation by 72 mm over 3 years. Foundation: calculate the relative rate. Core: also find the constant-rate time for a hypothetical 600 km opening. Honors: bound the rate if each position endpoint has +/-2 mm bounds and time is exact. All levels: explain why this is not a measured age or forecast.
Calibration: Foundation: 72/3 = 24 mm/year. Core: 600 x 1,000,000/24 = 25,000,000 years = 25 Myr. Honors: displacement bounds are 68-76 mm, so rate bounds are 22.667-25.333 mm/year. An unchanged rate is an assumption, not a measured age or an earthquake forecast.
Evidence to retain
Retain the rate calculation or circle solution at the agreed level, the labeled plot, the transfer calculation and one model limitation. These count in the Plate boundaries and rates and Seismic map reasoning science criteria. Supply the model sheet for oral or accessible written defense; record practical map-handling separately. Sources checked 2026-09-27.
Record units, calculations, source/date, uncertainty, and what is measured versus inferred. A simulation or supplied dataset must stay labeled as such. No field exposure or weather chasing; no water sampling, ingestion, or chemical tests; no solar viewing. Use supplied data and approved images or non-destructive indoor alternatives only. A worksheet does not demonstrate practical performance or authorize a real location or safety forecast.
Return to all eight learning pathways. Print this unit page for the student lessons; the linked five-page packet remains the separate assessment companion.
Unit mastery rubric
| Criterion | Developing | Proficient | Mastery |
|---|---|---|---|
| Earth's internal structure | Confuses the layers or thinks the whole interior is molten. | Names crust, mantle, and core but blurs composition layers with mechanical ones. | Distinguishes crust/mantle/core by composition and lithosphere/asthenosphere by behavior, and explains how we know (seismic waves). |
| Plate boundaries and rates | Confuses separation, time, or units. | Computes a rate with help but omits its reference frame or limits. | At the agreed level, calculates relative plate rate and defends the boundary model, units and constant-rate limits. |
| Evidence for plate tectonics | Treats plate tectonics as something to accept on authority. | Lists one line of evidence but cannot connect it to a mechanism. | Marshals matching coastlines/fossils, seafloor spreading, and paleomagnetism into the case that vindicated Wegener. |
| Earthquakes & volcanoes | Cannot relate their distribution to plates. | Names a boundary association without explaining it. | Explains broad earthquake and volcanic patterns without turning a plate-motion rate into a hazard forecast. |
| Seismic map reasoning | Confuses arrival delay with distance. | Calculates radii but needs help interpreting their intersections. | At the agreed level, defends the supplied S-P circle solution or bounds, coordinates and zero-depth assumption. |
| Integration (cross-domain) | Makes no supported connection between the source and the science. | Uses the source but needs help connecting evidence, writing, or limitations to the science. | Independently connects History, Reading, and Writing using a cited source, appropriate evidence, a limitation, and a scientific explanation. |
Integration is reported separately and cannot lower the science grade or block a science demonstration pass. Science and practical criteria determine that pass. Use the integration guide's evidence checklist for the separately reported criterion.
“The supplied markers separate 100 mm in four years: 25 mm/year. A 1000 km opening at that unchanged rate would take 40 Myr, but that is a model, not a measured opening date. The three nominal seismic circles meet at (0, 40) km only under the stated wave-speed and zero-depth assumptions.”
“The continents don’t really move, do they? And the inside of the Earth is all melted lava the whole way down.”
Agree the readiness level first. Submit the assigned rate or seismic-model work, units, limitations and fresh transfer, then defend the reasoning orally or through an approved accessible equivalent. These are science evidence; the source-linked writing is separately reported integration. Supplied traces do not demonstrate instrument operation or authorize fieldwork.
A 5-page clipboard packet — unit overview, key terms, the mastery rubric, anchor examples, and a score sheet you can print and grade against.