Unit 07 · Land, Agriculture & Waste
Compare defined land-use practices on equal output and real constraints. Preserve soil/horizon, agriculture, deforestation and waste concepts while measuring area, applied water, erosion, interval rates and processing rejects.
Student learning: Equal-output land, water, soil and waste tradeoffs
Choose the level by readiness, not age alone, and record it before instruction. Foundation, core, and honors tasks are study pathways, not an AP course or a promise of college credit. The instructor retains practical assessment and the published science rubric; integration is reported separately.
Prerequisites: Unit 4 resource accounting and Unit 5 runoff; multiplication by area, percentages and rates from successive observations.
Suggested sequence: read and discuss the explanation; attempt the worked model; analyze the data at your selected level; check the answers; then complete the source-linked response and a fresh transfer question. These activities supplement, not replace, supervised practical work and the full-year schedule.
Assigned reading and focus
- USDA NRCS: Soil Health. Read What is Soil Health? and Why is Soil Health Important? Identify measurable functions and the principles of cover, reduced disturbance, diversity and living roots. These are not yield guarantees at every site.
- USGS Water Science School: The Water Cycle. Reread Humans alter the water cycle. Distinguish water diverted or applied from water consumed, returned or stored.
- EPA: Non-Hazardous Materials and Waste Management Hierarchy. Read Source Reduction and Reuse, Recycling and Composting, Energy Recovery, and Treatment and Disposal. Note EPA’s statement that no single approach suits every material and circumstance.
- USDA NRCS: Soil Health Assessment. [soil-properties] From instrument records to texture, pore space and water: Review physical soil indicators and the limits of individual tests. Distinguish texture, bulk density, water content and soil health rather than treating one result as a fertility or safety certificate.
- CIMMYT: Our History. [green-revolution] Seed response depends on an input bundle: Read the account of wheat breeding, Norman Borlaug and the Green Revolution. Separate historical yield gains from claims that a variety or one input alone explains every regional outcome.
- EPA: Integrated Pest Management (IPM) Principles. [ipm-threshold] Scout, prevent, decide and reassess: Read Set Action Thresholds, Monitor and Identify Pests, Prevention, and Control. Explain why an action threshold is not simply the sight of one insect or permission to spray.
- FAO: Livestock and the environment. [meat-systems] Equal protein, unequal feed and land boundaries: Read the links between livestock, land, feed, nutrient cycles and emissions. Separate grazing and feed production from processing and consider both impacts and resource constraints.
- NOAA Fisheries: Understanding Fisheries Management in the United States. [fisheries-aquaculture] Wild-stock depletion and farmed-fish inputs: Read the role of science, catch limits and rebuilding. Distinguish overfishing (rate) from an overfished stock (state), and note bycatch and habitat concerns.
- NOAA Fisheries: Feeds for Aquaculture. [fisheries-aquaculture] Wild-stock depletion and farmed-fish inputs: Read fishmeal/fish-oil alternatives and feed efficiency. Identify why farmed species and feed composition matter and why by-products require allocation rules.
- Global Footprint Network: National Footprint and Biocapacity Accounts — data and methodology. [ecological-footprint] Six land-demand components, one explicit accounting method: Read Methodology and the descriptions of consumption, yield factors, equivalence factors, six land types and biocapacity. Separate the current national-account data product from this simplified teaching ledger.
Learn the science
Soil formation combines weathering, organic inputs and biological activity over time. Horizons reflect additions, losses and transformations; not every soil has every horizon. Texture, structure and compaction influence infiltration, water storage and erosion. A short infiltration record is not a complete test of fertility or contamination.
Compare farming practices on equal useful output before judging resource use. Per-hectare savings can disappear or reverse if more hectares are needed. The two methods below are bundles of specified outcomes, not claims that all industrial farms or all regenerative farms behave alike.
Applied irrigation water is not automatically consumptive water use: some returns to groundwater or streams or remains stored. Drip delivery can reduce application losses, but crop changes, area expansion and return-flow changes affect basin savings. Soil cover and rotation can affect erosion and nutrients; the size of effects needs site evidence.
Deforestation is removal of forest cover; desertification is degradation in drylands. They can involve altered runoff, soil loss and biodiversity but are not identical processes. Mining can disturb land and produce tailings or contaminated drainage depending on rock chemistry and controls. Urban impermeable surfaces change infiltration and runoff. These are mechanisms to investigate, not excuses to assume a result at every site.
Source reduction avoids material use before waste exists. Reuse retains products; recycling recovers material; composting treats suitable organics; energy recovery captures energy from combustion or gas. Landfills and combustion residues still require management. A collected recycling mass is not necessarily a recovered mass if a processor rejects part of it.
A mass balance must use a clear denominator. Here the stream is 100 kg of material already set aside for routing, including reuse. Prevention of a hypothetical future purchase is outside that stream and cannot be added to the recovered percentage. Sorting unknown waste, burning material or applying chemicals is not authorized.
[soil-properties] From instrument records to texture, pore space and water: Bulk density is dry soil mass divided by intact bulk volume, including pore space. With a stipulated particle density, porosity = 1 − bulk density/particle density. Volumetric water content uses water mass divided by water density and bulk volume; it is not the same as gravimetric water content. Texture is the sand/silt/clay distribution of the mineral fine-earth fraction, whereas structure describes aggregation and pore arrangement. Compaction can alter structure without changing texture.
[soil-properties] From instrument records to texture, pore space and water: Model and provenance assumptions: These are synthetic instrument-style records for intact 100-cm³ cores, not actual measured student samples. Dry mass excludes container tare; moist minus dry mass is water. Water density is 1 g/cm³, mineral particle density 2.6 g/cm³, and no gravel or organic-density correction is modeled.
[soil-properties] From instrument records to texture, pore space and water: Uncertainty and inference limits: Dry mass ±2 g and core volume ±2 cm³ bound record 1 bulk density at 128/102 to 132/98, about 1.2549–1.3469 g/cm³. Nearby cores are spatial replicates, not repeated weighings of one core. Texture closure and plausible pore volume are checks, not proof of contamination-free soil.
[green-revolution] Seed response depends on an input bundle: The Green Revolution combined improved crop varieties with changes in irrigation, fertilizer, pest management and agricultural institutions. Shorter-stem grain varieties can allocate more production to grain and resist lodging under high nutrient supply, but performance depends on environment and inputs. Food availability can improve while water depletion, nutrient loss, crop diversity and unequal access create costs. A factorial comparison can reveal that a genotype advantage changes with the input bundle.
[green-revolution] Seed response depends on an input bundle: Model and provenance assumptions: The synthetic grain trial holds crop, area and season constant and crosses traditional/modern seed with low/high input bundles. Nitrogen and irrigation both change with bundle; yield is tonnes dry grain/ha/season. These are not CIMMYT historical yield observations.
[green-revolution] Seed response depends on an input bundle: Uncertainty and inference limits: There is one model value per combination and no sampling uncertainty estimate. The apparent added-grain/added-N ratio cannot isolate a nitrogen effect because irrigation changes too. Rainfed transfer, seed cost, pests and market access require additional evidence.
[ipm-threshold] Scout, prevent, decide and reassess: IPM combines correct identification, monitoring, preventive practices and a threshold-based response, followed by evaluation. Natural enemies and crop tolerance can change the need for control. Action thresholds anticipate damage and delays before an economic-injury level is reached; the simplified break-even calculation below is only a decision model. Repeated use of one control can select resistance, lowering efficacy and changing both benefit and non-target effects.
[ipm-threshold] Scout, prevent, decide and reassess: Model and provenance assumptions: The synthetic decision covers an entire 40-plant model block with 300 correctly identified pests, not an estimate extrapolated to a farm. Each surviving pest is assigned $2 future crop loss, efficacy is 0.70 and control cost $250 for this block. Linear loss is stipulated.
[ipm-threshold] Scout, prevent, decide and reassess: Uncertainty and inference limits: Real damage is rarely linear per pest, identification can be wrong and natural enemies can reduce future abundance. Efficacy falling to 0.30 changes avoided loss to $180, below cost. No pesticide, release of predators or experimental crop treatment is authorized.
[meat-systems] Equal protein, unequal feed and land boundaries: A feed conversion ratio using live-weight gain cannot be compared directly with edible meat or protein. Convert equal edible-protein service back through protein fraction and edible yield before multiplying by feed. Grazing may use land unsuitable for crops, while grain-fed systems use arable feed inputs; hectares are not interchangeable. Ruminant methane, manure, nutrient losses, energy and animal welfare require additional endpoints rather than a single “best meat” label.
[meat-systems] Equal protein, unequal feed and land boundaries: Model and provenance assumptions: All rows are synthetic production systems over one model year and target 100 kg edible protein. Feed is total dry matter including forage, divided by wet live-weight gain; edible and protein fractions are nested mass fractions. Land columns are ha-years per 1000 kg live gain, including allocated feed land.
[meat-systems] Equal protein, unequal feed and land boundaries: Uncertainty and inference limits: Feed quality, breed, climate, co-product allocation, edible yield and protein quality vary. These examples are not average footprints of actual diets or claims that grazing land is arable. No land-use-change or methane quantity is supplied, so land rankings are not full climate rankings.
[fisheries-aquaculture] Wild-stock depletion and farmed-fish inputs: Harvest can reduce a wild stock when removals exceed net additions. Overfishing is a rate relative to a reference point; “overfished” refers to stock status, so a single declining year cannot establish the full management classification. Aquaculture can supply food but can also need wild feed inputs, generate wastes, transmit pathogens or introduce escapees. Unfed shellfish differ from fed finfish; neither all aquaculture nor all wild capture has one impact profile.
[fisheries-aquaculture] Wild-stock depletion and farmed-fish inputs: Model and provenance assumptions: The synthetic wild-stock ledger covers one closed annual interval; growth/recruitment adds 250 tonnes, other natural mortality removes 50. The farmed-fish model uses whole wild fish for meal at 0.25 kg dry meal/kg wet wild fish; no oil co-product credit is assigned.
[fisheries-aquaculture] Wild-stock depletion and farmed-fish inputs: Uncertainty and inference limits: Growth, recruitment and mortality vary with environment and stock size. The one-year harvest ceiling is not maximum sustainable yield (MSY). Feed conversion and edible yield vary; waste, escape and disease risks cannot be inferred from the feed ratio alone.
[ecological-footprint] Six land-demand components, one explicit accounting method: An ecological footprint expresses demand in global hectares (gha), productivity-adjusted area, not kWh or a universal pollution score. For each primary commodity, consumption = production + imports − exports; modeled demand = consumption/world yield × equivalence factor. Equivalently, domestic area × local/world yield factor × equivalence factor converts local hectares. Add cropland, grazing, fishing grounds, forest products, carbon uptake and built-up demand. Biocapacity = available area × yield factor × equivalence factor, with each physical area counted once.
[ecological-footprint] Six land-demand components, one explicit accounting method: Model and provenance assumptions: All factors and quantities below are synthetic and share one accounting year, normalized per person. Commodity inputs are mutually allocated primary-resource requirements, including feed conversion where needed; do not count the same feed again under animal output. Fishing demand is primary-production-equivalent biomass, not edible fish. Carbon is residual fossil CO₂ assigned to uptake after the model’s ocean allocation.
[ecological-footprint] Six land-demand components, one explicit accounting method: Uncertainty and inference limits: These invented factors are not official national accounts or a personal footprint result. Trade origin, processing losses, co-products, carbon uptake and habitat quality need much finer accounting in real applications. If uptake varies 1.5–2.5 tonnes CO₂/ha/year, total demand ranges 7.05–4.97 gha/person; this is sensitivity, not a confidence interval.

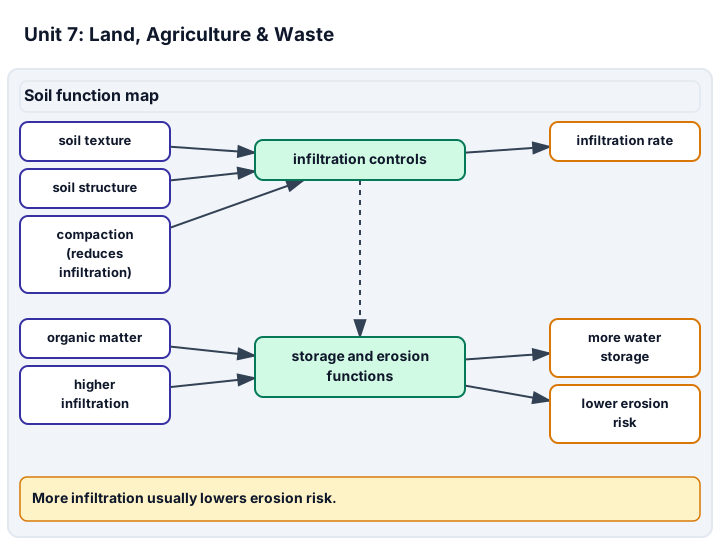
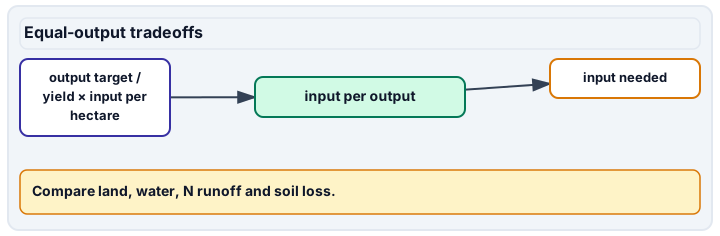
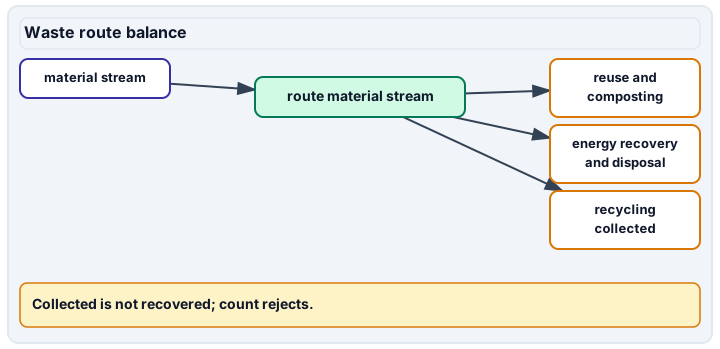
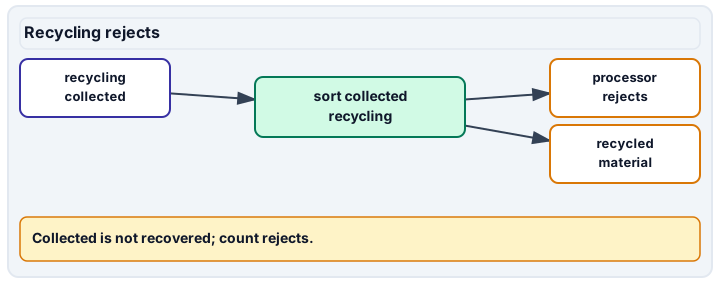
Diagram description
Soil texture and structure affect infiltration; compaction reduces infiltration; organic matter and higher infiltration support more water storage; higher infiltration usually lowers erosion risk. Equal-output tradeoffs compute inputs needed from output target, input per hectare and yield. Waste routing separates collected recycling, processor rejects and recycled material.
Data, provenance, and assumptions
| Method | Yield (tonnes/ha) | Irrigation applied (m³/ha) | N runoff (kg N/ha) | Soil erosion (tonnes/ha) |
|---|---|---|---|---|
| A | 8 | 6000 | 30 | 3 |
| B | 6 | 3600 | 12 | 1.5 |
| Elapsed time (minutes) | Cumulative infiltrated depth (mm) |
|---|---|
| 0 | 0 |
| 5 | 10 |
| 10 | 16 |
| 15 | 20 |
| Route | Input mass (kg) | Rejected to disposal (kg) |
|---|---|---|
| Reuse | 20 | 0 |
| Recycling | 30 | 10 |
| Composting | 25 | 5 |
| Disposal | 25 | 0 |
| Site code | Bulk core volume (cm³) | Dry soil mass (g) | Moist soil mass (g) | Particle density (g/cm³) | Core replicate | Sand (%) | Silt (%) | Clay (%) |
|---|---|---|---|---|---|---|---|---|
| 1 | 100 | 130 | 160 | 2.6 | 1 | 60 | 30 | 10 |
| 1 | 100 | 140 | 175 | 2.6 | 2 | 60 | 30 | 10 |
| 2 | 100 | 160 | 175 | 2.6 | 1 | 20 | 40 | 40 |
| Seed model | Input bundle | Yield (tonnes/ha/season) | Applied N (kg N/ha/season) | Irrigation (m³/ha/season) |
|---|---|---|---|---|
| Traditional | Low | 2 | 20 | 500 |
| Modern | Low | 2.5 | 20 | 500 |
| Traditional | High | 3 | 120 | 2000 |
| Modern | High | 6 | 120 | 2000 |
| Block | Plants counted | Pests counted | Future loss ($/pest) | Prevented-loss efficacy (fraction) | Control cost ($/block) |
|---|---|---|---|---|---|
| Model block | 40 | 300 | 2 | 0.7 | 250 |
| System | Dry feed kg/kg live gain | Edible fraction of live gain | Protein fraction of edible mass | Arable ha-years/1000 kg live gain | Grazing ha-years/1000 kg live gain |
|---|---|---|---|---|---|
| Pasture ruminant | 10 | 0.4 | 0.25 | 0.2 | 2 |
| Feedlot ruminant | 7 | 0.5 | 0.25 | 0.5 | 0.5 |
| Poultry | 2 | 0.7 | 0.2 | 0.3 | 0 |
| Start biomass (tonnes) | Growth/recruitment (tonnes/year) | Harvest (tonnes/year) | Other mortality (tonnes/year) | Target end biomass (tonnes) |
|---|---|---|---|---|
| 1000 | 250 | 300 | 50 | 1000 |
| Dry feed kg/kg live gain | Edible fraction of live gain | Fishmeal fraction of dry feed | Dry meal kg/kg wet wild fish |
|---|---|---|---|
| 1.5 | 0.6 | 0.2 | 0.25 |
| Land-demand component | Production (t/person/year) | Imports (t/person/year) | Exports (t/person/year) | World yield (t/ha/year) | Equivalence (gha/ha) |
|---|---|---|---|---|---|
| Cropland | 0.8 | 0.2 | 0.1 | 2 | 2.5 |
| Grazing | 0.08 | 0.04 | 0.02 | 1 | 1 |
| Forest products | 0.6 | 0.1 | 0.1 | 2 | 1.3 |
| Fishing primary production | 0.04 | 0.02 | 0.01 | 0.1 | 0.37 |
| Residual CO₂ (t/person/year) | World forest uptake (t CO₂/ha/year) | Forest equivalence (gha/ha) | Built area (ha/person) | Built yield factor | Built equivalence (gha/ha) |
|---|---|---|---|---|---|
| 6 | 2 | 1.3 | 0.02 | 1 | 2.5 |
| Physical land type | Available area (ha/person) | Local/world yield factor | Equivalence (gha/ha) |
|---|---|---|---|
| Cropland | 0.4 | 1.2 | 2.5 |
| Grazing | 0.2 | 1 | 1 |
| Forest | 0.3 | 1 | 1.3 |
| Fishing grounds | 0.5 | 1 | 0.37 |
| Built area | 0.02 | 1 | 2.5 |
Worked model
For 120 tonnes, A needs 120/8 = 15 ha, 90000 m³ irrigation, 450 kg N runoff and 45 tonnes eroded soil. B needs 20 ha, 72000 m³, 240 kg N and 30 tonnes soil. B uses 20% less applied water but 33.33% more land. A blanket claim that B reduces every resource requirement is false. [soil-properties] From instrument records to texture, pore space and water: Record 1 bulk density = 130/100 = 1.3 g/cm³; porosity = 1 − 1.3/2.6 = 0.5 cm³ pore/cm³ bulk soil. Water volume = (160−130)/1 = 30 cm³, so volumetric water = 0.30 and air-filled fraction 0.20. Site 1 density range = 1.4 − 1.3 = 0.1 g/cm³. [green-revolution] Seed response depends on an input bundle: Modern minus traditional yield is 0.5 tonnes/ha under low inputs and 3 under high inputs, an interaction contrast of 2.5 tonnes/ha/season. Modern-seed added yield per added N = (6−2.5)×1000/(120−20) = 35 kg grain/kg added N, but this is a bundled response, not isolated nitrogen-use efficiency. [ipm-threshold] Scout, prevent, decide and reassess: Pests/plant = 300/40 = 7.5. Modeled avoided loss = 300×2×0.7 = $420, or $170 above control cost. Break-even pest count = 250/(2×0.7) ≈ 178.571 for the block; an integer count of 179 is the first above break-even in this simplified model, not an operational recommendation. [meat-systems] Equal protein, unequal feed and land boundaries: For 100 kg protein, required live gain is 1000, 800 and about 714.286 kg. Feed is 10000, 5600 and 1428.571 kg dry matter. Total land is 2.2, 0.8 and about 0.214286 ha-years respectively. Pasture arable demand is 0.2 ha-years while feedlot arable demand is 0.4: total and arable rankings differ. [fisheries-aquaculture] Wild-stock depletion and farmed-fish inputs: End wild biomass = 1000 + 250 − 300 − 50 = 900 tonnes. To retain 1000 under these fixed flows, harvest must be at most 200 tonnes/year. Farm feed per kg edible output = 1.5/0.6 = 2.5 kg dry feed; wild fish required = 2.5×0.2/0.25 = 2 kg wet wild fish/kg edible output. [ecological-footprint] Six land-demand components, one explicit accounting method: Commodity gha/person are 1.125, 0.1, 0.39 and 0.185. Carbon = 6/2×1.3 = 3.9 and built area = 0.02×1×2.5 = 0.05. Total footprint = 5.75 gha/person. Biocapacity = 1.2 + 0.2 + 0.39 + 0.185 + 0.05 = 2.025 gha/person; deficit = 3.725. Carbon and timber compete for forest capacity, not two separate forests.
Numerical calibration
- 15 ha
- 20 ha
- 90000 m³ applied
- 72000 m³ applied
- 450 kg N
- 240 kg N
- 45 tonnes soil
- 30 tonnes soil
- 20 %
- 33.333333 %
- 6.666667 tonnes/ha
- 2 mm/minute
- 0.8 mm/minute
- 60 %
- 40 kg
- 1.3 g dry soil/cm³ bulk soil
- 0.5 cm³ pore/cm³ bulk soil
- 0.3 cm³ water/cm³ bulk soil
- 0.1 g/cm³ replicate range
- 1.2549019608 g/cm³ worst-case lower bound
- 1.3469387755 g/cm³ worst-case upper bound
- 0.2 cm³ air/cm³ bulk soil
- 0.3 cm³ water/cm³ bulk soil
- 2.5 tonnes grain/ha/season interaction
- 35 kg added grain/kg added N in bundled comparison
- 2 tonnes grain/ha/season interaction
- 7.5 pests/plant
- 420 $/block modeled avoided loss
- 178.5714285714 pests/block break-even model
- -70 $/block net benefit at efficacy 0.30
- -50 $/block modeled net benefit
- 10000 kg dry feed/100 kg edible protein
- 2.2 ha-years/100 kg edible protein
- 5600 kg dry feed/100 kg edible protein
- 0.8 ha-years/100 kg edible protein
- 1428.5714285714 kg dry feed/100 kg edible protein
- 0.2142857143 ha-years/100 kg edible protein
- 1000 kg dry feed/100 kg edible protein
- 900 tonnes wet biomass at year end
- 200 tonnes wet harvest/year in fixed model
- 2.5 kg dry feed/kg wet edible output
- 2 kg wet wild fish/kg wet edible output
- 2.4 kg wet wild fish/kg edible output at feed conversion 1.8
- 1 kg wet wild fish/kg wet edible output
- 5.75 gha/person for stated accounting year
- 2.025 gha/person for stated accounting year
- 3.725 gha/person demand minus capacity
- 4.97 gha/person at forest uptake 2.5 t CO₂/ha/year
- 7.05 gha/person at forest uptake 1.5 t CO₂/ha/year
- 3.8 gha/person for revised scenario
Attempt the assigned level
Try the tasks before reading the calibration. These are practice answers, not a secure examination; use a new dataset or changed assumption for the assessed transfer.
Foundation
- Find land area and applied water for both practices at 120 tonnes. Identify which assumptions make the comparison fair.
- Find the first-five-minute infiltration rate and distinguish it from cumulative depth.
- [soil-properties] From instrument records to texture, pore space and water: Check texture totals and calculate bulk density and volumetric water for record 1. Name which values depend on measurement and which are assumed constants.
- [green-revolution] Seed response depends on an input bundle: Calculate the modern-seed advantage under each bundle and describe why the history is more than replacing one seed variety.
- [ipm-threshold] Scout, prevent, decide and reassess: Calculate pests per plant and expected avoided loss for the block. Place identification, prevention, monitoring, response and evaluation in a defensible IPM sequence.
- [meat-systems] Equal protein, unequal feed and land boundaries: Convert the 100-kg edible-protein target to required live gain and feed for all three systems. Do not compare only the feed conversion ratios.
- [fisheries-aquaculture] Wild-stock depletion and farmed-fish inputs: Balance the wild-stock ledger and calculate the one-year harvest ceiling at the stated target. Explain why this is not a fitted long-term MSY estimate.
- [ecological-footprint] Six land-demand components, one explicit accounting method: Calculate cropland net consumption and its global-hectare demand, then convert the other three commodity rows without adding unlike tonnes.
Check after your attempt
- A: 15 ha and 90000 m³; B: 20 ha and 72000 m³. Crop, season, product quality and target output must be comparable.
- The initial rate is 10/5 = 2 mm/minute; 10 mm is cumulative depth, not a rate.
- [soil-properties] From instrument records to texture, pore space and water: Each texture sums to 100%. Record 1 density is 1.3 g/cm³ and water content 0.30 cm³/cm³. Mass and volume are supplied instrument-style values; water and particle densities are stipulated constants, not extra observed measurements.
- [green-revolution] Seed response depends on an input bundle: Advantages are 0.5 and 3 tonnes/ha/season. Breeding, water, nutrients, pest management and institutions interacted; a yield change alone cannot assign the entire historical effect to seed.
- [ipm-threshold] Scout, prevent, decide and reassess: There are 7.5 pests/plant and $420 modeled avoided loss. Establish identification/monitoring and preventive practice first, decide against an appropriate threshold, then evaluate response; seeing an organism is not enough to justify control.
- [meat-systems] Equal protein, unequal feed and land boundaries: Live gain is 1000, 800 and 714.286 kg; feed 10000, 5600 and 1428.571 kg dry matter. Edible yield and protein fractions change the conversion from live gain to equal nutritional output.
- [fisheries-aquaculture] Wild-stock depletion and farmed-fish inputs: End biomass is 900 tonnes; a 200-tonne harvest would retain 1000. A long-term reference point needs stock–recruitment dynamics, variability and management objectives, not one fixed annual ledger.
- [ecological-footprint] Six land-demand components, one explicit accounting method: Cropland consumption is 0.9 t/person/year; 0.9/2×2.5 = 1.125 gha/person. Grazing, forest and fishing contributions are 0.1, 0.39 and 0.185 gha/person after their own yield conversions.
High-school core: typically grades 9-10
- Calculate total runoff nitrogen and erosion and the percentage water saving and land increase.
- Compute actual recovered and disposed mass after recycling/composting rejects. Calculate the final-five-minute infiltration rate.
- [soil-properties] From instrument records to texture, pore space and water: Calculate porosity and air-filled fraction for record 1 and compare site 1 replicate density range. Why is a texture label not enough to infer infiltration?
- [green-revolution] Seed response depends on an input bundle: Compute the difference in seed advantages and apparent added-grain/added-N ratio. Explain the nitrogen attribution problem.
- [ipm-threshold] Scout, prevent, decide and reassess: Find the block’s modeled break-even count and name a beneficial-organism observation and a nonchemical prevention option that could change the decision.
- [meat-systems] Equal protein, unequal feed and land boundaries: Calculate total and arable land per protein target. Under an arable-land cap of 0.3 ha-years, which modeled systems fit, without treating all land as equivalent?
- [fisheries-aquaculture] Wild-stock depletion and farmed-fish inputs: Calculate feed and wild-fish inputs per kg edible farmed output. Name two outcomes the ratio cannot quantify and explain why unfed bivalves require a different model.
- [ecological-footprint] Six land-demand components, one explicit accounting method: Add carbon and built-up demand, compute total biocapacity and deficit, and explain why an extra carbon forest capacity row would double-count.
Check after your attempt
- A: 450 kg N and 45 tonnes soil; B: 240 kg N and 30 tonnes soil. Applied-water saving is 20%; land increase 33.33%. Basin consumption is still unknown.
- Recovered mass is 20 + 20 + 20 = 60 kg, or 60%; final disposal is 40 kg. Final infiltration rate is (20 − 16)/5 = 0.8 mm/minute, so a constant 2 mm/minute extrapolation fails.
- [soil-properties] From instrument records to texture, pore space and water: Porosity is 0.50, air-filled fraction 0.20 and density range 0.10 g/cm³. Structure, compaction, antecedent water and macropores affect infiltration even with unchanged sand/silt/clay proportions.
- [green-revolution] Seed response depends on an input bundle: The interaction is 2.5 tonnes/ha/season and apparent response 35 kg grain/kg added N. Irrigation also rises from 500 to 2000 m³/ha, so the model cannot isolate a nitrogen effect.
- [ipm-threshold] Scout, prevent, decide and reassess: Break-even is about 178.571 pests, with 179 the first integer above it. Natural-enemy abundance and crop rotation or exclusion may change expected damage; these are paper proposals, not instructions to release or manipulate organisms.
- [meat-systems] Equal protein, unequal feed and land boundaries: Total land is 2.2, 0.8 and 0.214286 ha-years; arable land 0.2, 0.4 and 0.214286. Pasture and poultry fit the stated arable cap, but grazing hectares are not interchangeable with cropland and other constraints remain.
- [fisheries-aquaculture] Wild-stock depletion and farmed-fish inputs: Inputs are 2.5 kg dry feed and 2 kg wet wild fish/kg edible output. Nutrient discharge, disease or escapes need other records. Unfed filter feeders do not use this formulated-feed pathway and can still have site-specific ecological effects.
- [ecological-footprint] Six land-demand components, one explicit accounting method: Demand totals 5.75 gha/person; biocapacity is 2.025 and deficit 3.725. Carbon uptake and timber are competing demands against the same forest capacity, which must not be entered twice.
Honors extension: typically grades 11-12
- Only 18 ha is available without habitat conversion. Can each method meet 120 tonnes? Find B’s minimum yield to meet the target.
- Identify a measurement that would distinguish reduced irrigation application from reduced basin consumption. Explain why collected recycling mass overstates recovery here.
- [soil-properties] From instrument records to texture, pore space and water: Bound density with dry mass ±2 g and volume ±2 cm³. Propose an approved non-destructive observation or supplied-record extension linking compaction to runoff.
- [green-revolution] Seed response depends on an input bundle: Design a paper-only expanded factorial that separates seed, nitrogen and irrigation, and identify two outcomes besides grain yield needed for a constrained decision.
- [ipm-threshold] Scout, prevent, decide and reassess: Recompute the benefit if efficacy falls to 0.30. Explain how resistance, mistimed control or misidentification could be distinguished using supplied follow-up records.
- [meat-systems] Equal protein, unequal feed and land boundaries: Explain how changing edible yield, co-product allocation and methane accounting could alter a broader system comparison. State one measurement needed beyond feed mass.
- [fisheries-aquaculture] Wild-stock depletion and farmed-fish inputs: If feed conversion rises to 1.8 with other factors fixed, recalculate wild input. Propose safe supplied records for bycatch, stock uncertainty and aquaculture waste assessment.
- [ecological-footprint] Six land-demand components, one explicit accounting method: Bound total demand using forest uptake 1.5–2.5 t CO₂/ha/year. Explain what this metric leaves out and why it is not a complete policy or biodiversity ranking.
Check after your attempt
- A can meet the target on 15 ha. B produces only 108 tonnes on 18 ha; it needs at least 120/18 ≈ 6.667 tonnes/ha. Choose or redesign under explicit constraints rather than forcing a preferred label.
- Measure withdrawals, return flows, evapotranspiration and storage over the same area/time boundary. The 15 kg of rejects are not recovered material; counting collection alone gives 75% instead of the actual 60%.
- [soil-properties] From instrument records to texture, pore space and water: Bounds are about 1.2549–1.3469 g/cm³, not a confidence interval. Compare independent matched sites using supplied core/infiltration records or approved surface photos; do not oven-dry soil or infer contamination safety from pore space.
- [green-revolution] Seed response depends on an input bundle: Request replicated seed × N × irrigation records with independent plots and matched soil. Include water withdrawal/return flows, nitrogen loss, costs or access; a high yield is not a predetermined verdict about every resource or social outcome.
- [ipm-threshold] Scout, prevent, decide and reassess: Avoided loss becomes $180 and net benefit −$70. Compare matched independent blocks, pest identity, timing and efficacy history before attributing failure to resistance; one poor outcome does not prove evolution of resistance.
- [meat-systems] Equal protein, unequal feed and land boundaries: Lower edible yield raises all inputs per unit protein; assigning co-product burdens changes totals, and methane can alter climate rankings. Request measured emissions with a time horizon, nutrient losses or land-use-change data rather than inferring them from hectares alone.
- [fisheries-aquaculture] Wild-stock depletion and farmed-fish inputs: Wild input rises to 1.8/0.6×0.2/0.25 = 2.4 kg/kg edible output. Use existing catch/effort, non-target mortality, independent stock surveys and nutrient/escape records; do not catch fish or visit hazardous water sites.
- [ecological-footprint] Six land-demand components, one explicit accounting method: Noncarbon demand is 1.85 gha/person; carbon adds 5.2 or 3.12, giving 7.05 or 4.97. Toxicity, water scarcity, local habitat quality and equity are not fully represented; factor choices and accounting boundaries remain critical.
History, reading, and writing connection
Use the NRCS account of soil functions and EPA’s waste hierarchy to write an evidence-based resource recommendation. Distinguish a practice’s intended purpose from demonstrated local outcomes. Explain why a history of technological change does not make either “traditional” or “industrial” an automatic scientific verdict.
Write in your own words or use an approved accessible equivalent. Cite a specific assigned section or figure, identify its evidence, and state one limitation or counterargument. Use the AI practice contract only for permitted coaching, never to invent observations or write the assessed response.
Transfer to a new case
A fresh season improves B yield to 7.5 tonnes/ha while applied irrigation stays 3600 m³/ha. At 120 tonnes, does B now fit the 18-ha limit and how much water is applied? [soil-properties] From instrument records to texture, pore space and water: A fresh synthetic core has 100 cm³ bulk volume, 120 g dry mass and 150 g moist mass. With water density 1 g/cm³, find volumetric water content and distinguish it from the gravimetric fraction. [green-revolution] Seed response depends on an input bundle: In a fresh dry-season model, traditional/modern yields are 1.5/2 at low inputs and 2.5/5 at high inputs, all tonnes/ha. Compute the interaction contrast rather than reusing the original result. [ipm-threshold] Scout, prevent, decide and reassess: A new synthetic 40-plant block has 200 pests, loss $2 per pest, efficacy 0.50 and cost $250. Find net modeled benefit and state the next monitoring question instead of prescribing a treatment. [meat-systems] Equal protein, unequal feed and land boundaries: A fresh synthetic poultry system has edible fraction 0.80, protein fraction 0.25 and feed ratio 2 kg dry feed/kg live gain. For 100 kg edible protein, find required feed and state its mass basis. [fisheries-aquaculture] Wild-stock depletion and farmed-fish inputs: A new synthetic feed system uses 1.2 kg dry feed/kg live gain, edible fraction 0.60, fishmeal fraction 0.10 and dry meal yield 0.20 kg/kg wet wild fish. Find wild input per kg edible output. [ecological-footprint] Six land-demand components, one explicit accounting method: For a fresh synthetic consumption plan, residual assigned CO₂ falls from 6 to 3 t/person/year; all commodity, built-area and productivity inputs remain unchanged. Find the new six-component footprint.
Calibration: B needs 16 ha and 57600 m³, so it fits the land limit. This changed assumption alters the decision; it still does not quantify basin-wide consumption or effects on other crops. [soil-properties] From instrument records to texture, pore space and water: Volumetric water is (150−120)/100 = 0.30 cm³/cm³; gravimetric water is 30/120 = 0.25 g/g. Their different denominators explain the different values. [green-revolution] Seed response depends on an input bundle: The seed advantages are 0.5 and 2.5, so the interaction is 2 tonnes/ha. A changed environment changes the response without establishing which input caused it. [ipm-threshold] Scout, prevent, decide and reassess: Net benefit is 200×2×0.5 − 250 = −$50. Recheck future pest growth, natural enemies, crop susceptibility and lower-impact prevention options before selecting a response. [meat-systems] Equal protein, unequal feed and land boundaries: Live gain is 100/(0.8×0.25) = 500 kg and feed is 1000 kg dry matter. It is not 1000 kg edible food or a complete environmental footprint. [fisheries-aquaculture] Wild-stock depletion and farmed-fish inputs: Wild input is 1.2/0.6×0.1/0.2 = 1 kg wet wild fish/kg edible output. This lower ratio does not establish zero waste, no escape risk or overall sustainability. [ecological-footprint] Six land-demand components, one explicit accounting method: The four commodity components total 1.8 gha/person; carbon is 3/2×1.3 = 1.95 and built area 0.05, so total demand is 3.8 gha/person. It remains an illustrative model, not a verified personal account.
Evidence to retain
Keep equal-output calculations, the land constraint, interval rates and material balance. An approved practical uses safe site observation or documented clean materials; do not enter hazardous sites, handle waste, excavate, burn, or apply pesticides/fertilizers. [soil-properties] From instrument records to texture, pore space and water: Retain texture closure, tare-aware density/water calculations, pore-volume check and instrument-bound sensitivity. Use Unit 7 soil-property, land-mechanism and technique criteria; supplied records are not performed soil measurements. [green-revolution] Seed response depends on an input bundle: Retain the factorial table contrasts, historical mechanism/source note and a non-yield tradeoff with a proposed isolating design. Use Unit 7 soil, agricultural-resource and land-use criteria; no chemical application is assigned. [ipm-threshold] Scout, prevent, decide and reassess: Retain the monitored-block denominator, threshold arithmetic, prevention/natural-enemy note and efficacy sensitivity. Assess Unit 7 agricultural, land-management and data-technique evidence without awarding pesticide-handling credit. [meat-systems] Equal protein, unequal feed and land boundaries: Retain the nested mass-fraction conversions, separate arable/grazing totals, binding constraint and one omitted lifecycle endpoint. Use Unit 7 resource, land-use and quantitative-defense criteria, without prescribing a diet or claiming measured farm outcomes. [fisheries-aquaculture] Wild-stock depletion and farmed-fish inputs: Keep the stock ledger, target harvest, feed mass-basis conversions and a waste/escape/bycatch evidence request. Use Unit 7 resource, land/water-use, material-balance and data criteria; supplied records require no wildlife capture. [ecological-footprint] Six land-demand components, one explicit accounting method: Retain the six-component ledger, source method, yield/equivalence units, trade boundary, one-count biocapacity check and sensitivity. Use Unit 7 resources, land mechanisms, material accounting and data-defense criteria; no official footprint certification is implied.
Record units, calculations, source/date, uncertainty, and what is measured versus inferred. A simulation or supplied dataset must stay labeled as such. Use supplied data or an instructor-approved supervised observation. No electrical work, combustion, radioactive materials, pesticide application, wildlife capture, microbial culture, hazardous sampling or sample ingestion is authorized.
Return to all eight learning pathways. Print this unit page for the student lessons; the linked five-page packet remains the separate assessment companion.
Unit mastery rubric
| Criterion | Developing | Proficient | Mastery |
|---|---|---|---|
| Soil formation and properties | Treats soil as uniform dirt. | Names horizons or texture. | Explains soil formation, texture and structure; interprets infiltration, density, porosity and water content without inferring contamination safety. |
| Agricultural resource tradeoffs | Ranks labels without quantities. | Compares only per-hectare inputs. | Compares equal-output farming/feed, Green Revolution responses and IPM thresholds; states land/water constraints and uncertainty. |
| Land-use mechanisms | Conflates deforestation and desertification. | Names a consequence. | Distinguishes forest loss/dryland degradation, mining/urbanization, fishery/aquaculture and footprint boundaries; requests site evidence. |
| Waste hierarchy and material balance | Counts all collection as recovery. | Lists routes without rejects. | Explains prevention/reuse/recycling/recovery/disposal and balances a material stream including rejected mass. |
| Soil and land-data technique | Omits protocol or source. | Records inconsistently. | Demonstrates approved observation/sampling or an approved alternative; records units, intervals and limits without unsafe handling. |
| Integration (cross-domain) | Makes no supported connection between the source and the science. | Uses the source but needs help connecting evidence, writing, or limitations to the science. | Independently connects History, Reading, and Writing using a cited source, appropriate evidence, a limitation, and a scientific explanation. |
Integration is reported separately and cannot lower the science grade or block a science demonstration pass. Science and practical criteria determine that pass. Use the integration guide's evidence checklist for the separately reported criterion.
For 120 tonnes, B saves 18000 m³ applied water but needs five more hectares. It cannot meet that output on 18 ha at the original yield. I must name the constraint before recommending a method.
B uses less water per hectare, so it is better on every environmental measure.
Retain approved soil/land observation and an oral data defense. Classroom calculations do not authorize waste sorting, pesticide use or uncontrolled soil experiments.
A 5-page clipboard packet — unit overview, key terms, the mastery rubric, anchor examples, and a score sheet you can print and grade against.