Unit 03 · Trace Evidence
Use a supplied hair model, synthetic fiber readings, and glass/soil records to distinguish class consistency from source identity. Retain repeated measurements and every compatible reference. Compare direct, secondary, and background transfer accounts, including nondetection; contact does not guarantee a detectable trace. Work from paper/image records only, without hair collection, shards, or chemical tests.
Student learning: Separate material consistency from source and transfer claims
Choose the level by readiness, not age alone, and record it before instruction. Foundation, core, and honors tasks are study pathways, not an AP course or a promise of college credit. The instructor retains practical assessment and the published science rubric; integration is reported separately.
Prerequisites: Units 1–2; means, ranges, measurement intervals, and conditional frequencies.
Suggested sequence: read and discuss the explanation; attempt the worked model; analyze the data at your selected level; check the answers; then complete the source-linked response and a fresh transfer question. These activities supplement, not replace, supervised practical work and the full-year schedule.
Assigned reading and focus
- NIJ: Overview of Trace Evidence. Read the opening paragraph and the three research-priority bullets. Identify the difference between detecting trace material and interpreting what a transfer means; critically qualify any source claim using the information actually supplied.
- NIST: DNA Mixture Interpretations: A Q&A With NIST’s John Butler. Read Why are forensic scientists now frequently dealing with casework that requires analyzing DNA mixtures in their labs? Use the secondary-transfer example as a conceptual warning, not an instruction to collect DNA.
Learn the science
Locard’s exchange principle motivates searching for transfers; it does not promise every contact leaves a detectable, persistent trace. Transfer, persistence, recovery, and detection are different steps. A fiber can move indirectly through another surface; background fibers can already be present.
Microscopic hair features such as cuticle, cortex, medulla, and pigment distribution can be compared in supplied images. Their appearance alone cannot identify a person or supply a racial identity. DNA analysis is a separate test with its own limitations, not a way to turn a microscopic similarity into certainty.
Compare fibers using multiple recorded properties: material, color, cross-section, dimensions, and, where supplied, dye behavior. Within-source variability can overlap between sources. In this teaching rule, the material/color/shape must agree and the mean diameter must be within 2 micrometers; this is not a validated forensic threshold.
Reference and questioned images need the same magnification and a scale. Repeated diameter readings on one fiber describe reading variation, not three independent source specimens. Blind readers should keep their original measurements and explain boundary placement before discussing conclusions.
Glass refractive-index intervals can overlap without identifying one pane. Soil settled-layer proportions depend on sampling and method; similar layers are class evidence. Use supplied images/numbers only, never handle glass shards, burn fibers, or apply chemical or density tests.
A likelihood ratio compares probabilities of the evidence under specified explanations, not probabilities of guilt. In the fictional transfer counts, detection is six times as frequent for direct contact as for background, but only three times as frequent as for secondary transfer. Change the alternative and the ratio changes; dependencies prevent casually multiplying such results.

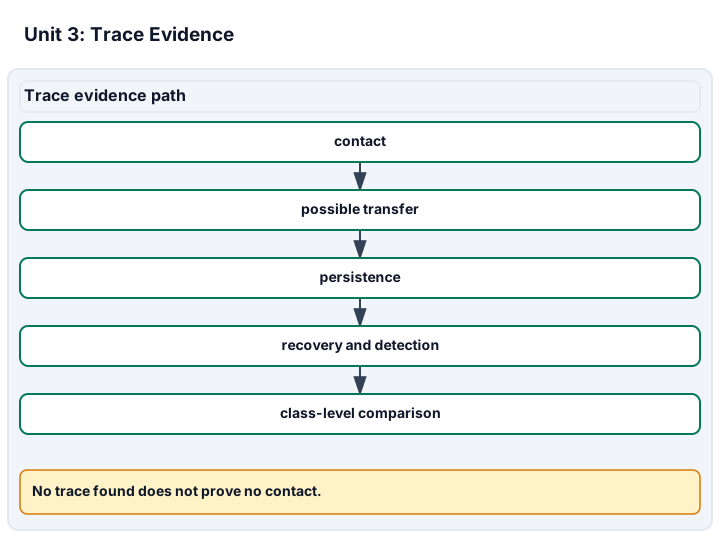
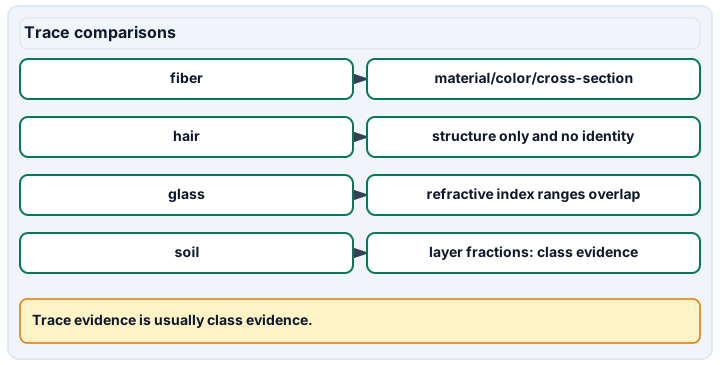
Diagram description
Trace evidence path shows contact may produce transfer, which must persist, be recovered/detected, and compared at class level. Trace comparisons lists fiber, hair, glass and soil comparison limits.
Data, provenance, and assumptions
| Region | Position in model | Structural feature |
|---|---|---|
| cuticle | outer boundary | overlapping protective scales |
| cortex | middle region | keratin-rich region with pigment |
| medulla | central region | may be absent or discontinuous |
| Card | Material label | Color | Cross-section | Read 1 (µm) | Read 2 (µm) | Read 3 (µm) |
|---|---|---|---|---|---|---|
| A | polyester | blue | trilobal | 22 | 24 | 23 |
| B | cotton | blue | ribbon | 12 | 14 | 13 |
| C | polyester | blue | trilobal | 23 | 24 | 25 |
| Q | polyester | blue | trilobal | 23 | 24 | 25 |
| Card | Glass refractive index | RI bound (±) | Sand-layer volume | Total settled volume | Glass density (g/cm³) | Density bound (± g/cm³) |
|---|---|---|---|---|---|---|
| A | 1.52 | 0.002 | 40 | 100 | 2.5 | 0.02 |
| B | 1.54 | 0.002 | 70 | 100 | 2.6 | 0.02 |
| Q | 1.521 | 0.002 | 42 | 100 | 2.51 | 0.02 |
| Scenario | Target detected | Total trials |
|---|---|---|
| direct | 12 | 20 |
| secondary | 4 | 20 |
| background | 2 | 20 |
Blind dimensions, replicated readings, and competing transfer accounts
Scope and safety: Printed hair/fiber diagrams and supplied glass/soil records only; no human hair collection, shards, chemical tests, or environmental sampling.
Materials and preparation
- Draw the hair model from its supplied key and use the coded fiber dimensions; ruler or supplied numerical measurements.
- Two reader sheets, a hidden material key, and the synthetic data tables.
Procedure and schedule
- Draw and label the nested hair regions from the key; explain that this is a model, not an observed specimen. Before revealing fiber labels, record the given scale and comparison rule.
- Two readers separately mark the fiber boundaries and repeat a diameter reading three times; record all values, not only the closest match.
- Compute mean and range, then compare material, color, shape, and diameter with A, B, and C. Preserve each reader’s first conclusion before the key is revealed.
- Compare the supplied glass intervals and soil-layer fractions without treating either as an individualizing identifier.
- Use the transfer table to test both a direct-versus-background account and a direct-versus-secondary account. Discuss a nondetection before reading the answers.
Record: Retain scale/feature sketches, raw repeated readings with specimen IDs, candidate set, RI intervals, soil fractions, transfer ratios, and a source-versus-activity limitation.
Worked model
Q’s mean is (23 + 24 + 25)/3 = 24 µm, with range 23–25. A averages 23 and C averages 24, so both remain compatible under the teaching rule; B disagrees in material/shape. Detection frequencies are 12/20 = 0.6 for direct transfer and 2/20 = 0.1 for background, giving LR = 6. This is conditional on the fictional alternatives, not a source identification.
Numerical calibration
- 24 µm; one specimen read three times
- 6 synthetic LR for direct versus background detection
- 3 synthetic LR for direct versus secondary detection
- 40 % of direct-contact trials without detected target
Attempt the assigned level
Try the tasks before reading the calibration. These are practice answers, not a secure examination; use a new dataset or changed assumption for the assessed transfer.
Foundation
- Label the simplified hair model, then find Q’s fiber mean and range and list which recorded properties disagree for B.
- Draw the distinction between direct, secondary, and background transfer using paper arrows; identify what the absent target count means.
Check after your attempt
- The hair key places cuticle outside, cortex in the middle, and a potentially absent/discontinuous medulla centrally; it is not a personal identification. Q’s fiber mean is 24 µm and range 23–25 µm. B is cotton/ribbon rather than polyester/trilobal; matching color alone is insufficient.
- Direct means a transfer through the defined contact, secondary means an intermediate surface, and background means pre-existing material. Eight of 20 direct trials still lack detectable target material, so absence does not rule out contact.
High-school core: typically grades 9-10
- Apply the multi-property rule and report the complete compatible set, not a preferred source. Plot the three glass RI and density intervals.
- Calculate the sand-layer fractions and direct-contact nondetection fraction. Explain why repeated readings do not enlarge the number of specimens.
Check after your attempt
- A and C remain compatible; B is excluded within the stated fiber rule. No dye measurement is supplied here, so do not claim a dye match. Q’s RI interval is 1.519–1.523, overlapping A’s 1.518–1.522 but not B’s 1.538–1.542. Q’s density interval 2.49–2.53 g/cm³ likewise overlaps A (2.48–2.52) but not B (2.58–2.62). These class-property agreements are not proof of one pane or automatically independent evidence.
- Sand-layer fractions are A 40%, B 70%, Q 42%; no geographical frequency or validated cutoff is supplied. Direct-contact nondetection is 8/20 = 40%. The three diameter readings belong to one Q fiber, not three independent fibers.
Honors extension: typically grades 11-12
- Calculate direct/background and direct/secondary likelihood ratios using comparable groups. State the alternative in each denominator.
- Explain why multiplying “polyester,” “trilobal,” diameter agreement, and three repeated readings would overstate evidence. Propose better validation sampling.
Check after your attempt
- The ratios are 0.6/0.1 = 6 and 0.6/0.2 = 3. They evaluate this detection event under two different sets of fictional explanations; they do not identify a source or date of contact.
- These features and readings are not independent: material can affect shape, and repeated readings share a specimen. Use many independently sampled source objects, background controls, held-out comparisons, blinded records, and uncertainty before estimating method performance.
History, reading, and writing connection
Compare the NIJ trace overview’s promise of association with Butler’s secondary-transfer discussion. Write a source-cited explanation of why improved detection sensitivity changes the questions an analyst must answer. Preserve the distinction between historical evidence collection and a modern activity-level inference.
Write in your own words or use an approved accessible equivalent. Cite a specific assigned section or figure, identify its evidence, and state one limitation or counterargument. Use the AI practice contract only for permitted coaching, never to invent observations or write the assessed response.
Transfer to a new case
A new Q fiber is compatible with four reference garments rather than two, and no background sample was collected. Can the original LR of 6 identify one garment?
Calibration: No. Report the compatible set. That LR came from a fictional transfer study, not garment frequencies, and the new background is unknown. Source association and activity inference require different data.
Evidence to retain
Submit the blind comparison matrix, labeled scale/structure sketch, all repeats, mean/range, full compatible set, glass/soil comparison, two explicitly conditioned ratios, and nondetection analysis.
Record units, calculations, source/date, uncertainty, and what is measured versus inferred. A simulation or supplied dataset must stay labeled as such. Fictional cases only. No real bodily samples, personal fingerprints, suspect profiles, personal-device searches, chemicals, cultivation, firearms, ammunition, or projectiles. Use paper, printed diagrams, and supplied mock data. Synthetic arithmetic checks are not empirical forensic-method validation or classroom pilot evidence.
Return to all eight learning pathways. Print this unit page for the student lessons; the linked five-page packet remains the separate assessment companion.
Unit mastery rubric
| Criterion | Developing | Proficient | Mastery |
|---|---|---|---|
| Locard's exchange principle | Treats detection as proof of direct contact. | Names transfer but ignores background or nondetection. | Distinguishes direct, secondary, and background transfer; compares conditioned detection frequencies and explains why nondetection does not exclude contact. |
| Hair comparison & its limits | Identifies a person from a hair image. | Compares morphology but overstates its specificity. | Labels hair structures in supplied microscopic images and explains why morphology alone cannot identify a person; DNA is a separate, limited analysis. |
| Fiber comparison | Selects a source from color alone. | Compares properties but omits alternative compatible sources. | Compares material, color, cross-section, dimensions, and supplied dye evidence; retains the full compatible set and distinguishes class consistency from identity. |
| Glass & soil analysis | Ignores units and reading limits. | Compares values without uncertainty or source limits. | Compares supplied refractive-index/density intervals and soil-layer fractions as class evidence, without handling shards or claiming a unique location. |
| Comparison microscopy & documentation | Omits scale, controls, or the original record. | Repeats readings but counts them as new specimens. | Retains scaled image comparisons, blind initial readings, means/ranges, and specimen IDs; explains within-source variation, dependency, and unresolved differences. |
| Integration (cross-domain) | Makes no supported connection between the source and the science. | Uses the source but needs help connecting evidence, writing, or limitations to the science. | Independently connects History, Reading, and Writing using a cited source, appropriate evidence, a limitation, and a scientific explanation. |
Integration is reported separately and cannot lower the science grade or block a science demonstration pass. Science and practical criteria determine that pass. Use the integration guide's evidence checklist for the separately reported criterion.
“Q averages 24 µm; A and C both remain compatible. Three readings of one fiber are not three specimens. The invented detection LR is 6 against background but 3 against secondary transfer; neither identifies a garment or proves contact.”
“The hairs look the same under the scope, so they’re definitely from the same person — that proves she was there.”
Use supplied microscopic images and glass/soil measurements for controlled side-by-side comparison. Retain independent original readings, scale, repeat spread, exclusions, and alternative compatible sources. Explain transfer and detection limitations without collecting hair, handling shards, or performing chemical tests.
A 5-page clipboard packet — unit overview, key terms, the mastery rubric, anchor examples, and a score sheet you can print and grade against.