Unit 04 · Chromatography & Chemical Analysis
Interpret supplied paper chromatograms to explain mobile/stationary phases, compute Rf per replicate, and compare two-band mixtures under two conditions. Use fictional detector records for blank correction, calibration range, and hidden-QC recovery. Distinguish screening, validated confirmation, concentration, and human effect without handling chemicals, drugs, or biological samples.
Student learning: Separate compounds, check controls, and calibrate an unknown
Choose the level by readiness, not age alone, and record it before instruction. Foundation, core, and honors tasks are study pathways, not an AP course or a promise of college credit. The instructor retains practical assessment and the published science rubric; integration is reported separately.
Prerequisites: Ratios, means, linear graphs, unit labels, and material properties; Unit 3 controls and comparison limits.
Suggested sequence: read and discuss the explanation; attempt the worked model; analyze the data at your selected level; check the answers; then complete the source-linked response and a fresh transfer question. These activities supplement, not replace, supervised practical work and the full-year schedule.
Assigned reading and focus
- NIJ: Forensic Toxicology Research and Development. Read both opening paragraphs and the five NIJ research goals. Separate detecting a substance from interpreting concentration, redistribution, or a human effect. No biological sampling or actual toxicology experiment is assigned.
Learn the science
In chromatography a mobile phase carries components past a stationary phase. Different interactions with the two phases can separate a mixture. A chromatogram is a measurement pattern, not a direct reading of a person or a crime. These supplied paper diagrams contain two idealized bands per colored mixture.
For planar chromatography, Rf = distance traveled by a band’s center / distance traveled by the solvent front, both from the same origin on the same run. The ratio has no units. Solvent, paper, temperature, loading, and marking uncertainty can change it; compare references and questioned mixtures under the same conditions.
Two substances can co-migrate in one solvent. A second separation condition can distinguish the references here, but an untested substance can still share the pattern. A blank checks contamination; a known standard checks expected behavior. A blank band or failed reference makes the affected run uninterpretable until investigated.
A presumptive screen narrows possibilities, often accepting sensitivity at the cost of specificity. A confirmatory method must be appropriately validated for the identification claim, sample matrix, interference, and detection limits. Repeating the same nonspecific screen is not independent confirmation.
The separate detector model below uses response = 5 × concentration + 2, with arbitrary teaching units. Subtract the blank intercept before estimating concentration. Repeatability describes repeated response variation; recovery against a hidden known concentration checks accuracy in this constructed model. Neither establishes clinical impairment or a forensic method’s performance.
Toxicology extends chemical analysis to biological matrices in professional settings. Detection, concentration, timing, and effect are separate questions; metabolism and redistribution can matter. We analyze fictional response records only, with no substances, doses, bodily material, or medical interpretation.

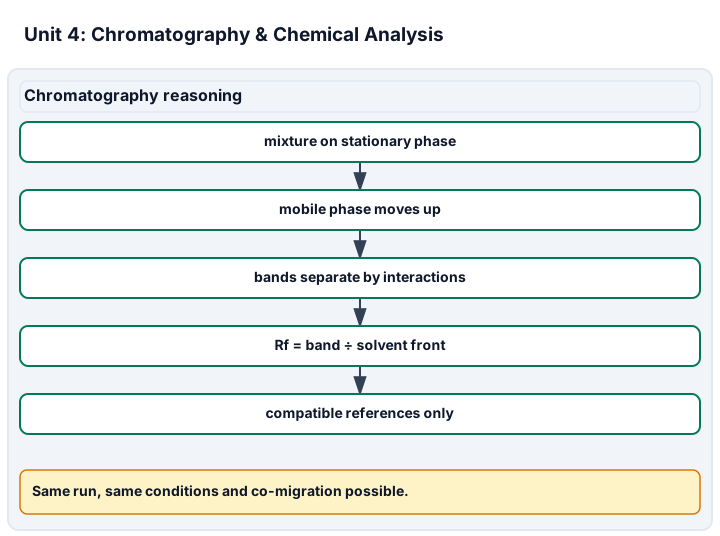
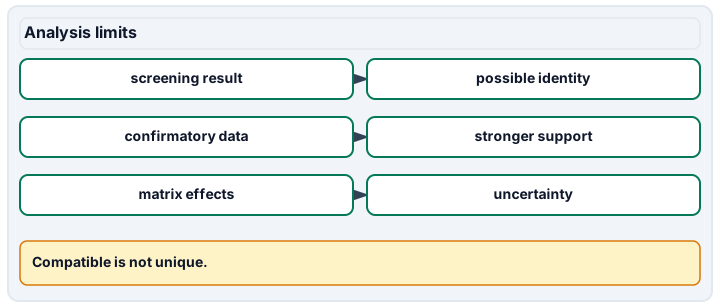
Diagram description
Chromatography reasoning shows stationary phase, mobile phase, interaction-based separation, Rf calculation and reference compatibility. Analysis limits distinguishes screening, confirmation and matrix uncertainty.
Data, provenance, and assumptions
| Solvent | Card | Replicate | Band 1 (mm) | Band 2 (mm) | Front (mm) |
|---|---|---|---|---|---|
| S1 | A | 1 | 40 | 70 | 100 |
| S1 | A | 2 | 32 | 56 | 80 |
| S1 | B | 1 | 41 | 71 | 100 |
| S1 | B | 2 | 34 | 58 | 80 |
| S1 | Q | 1 | 40 | 70 | 100 |
| S1 | Q | 2 | 32 | 56 | 80 |
| S1 | blank | 1 | none | none | 100 |
| S2 | A | 1 | 20 | 50 | 100 |
| S2 | A | 2 | 16 | 40 | 80 |
| S2 | B | 1 | 60 | 80 | 100 |
| S2 | B | 2 | 48 | 64 | 80 |
| S2 | Q | 1 | 21 | 50 | 100 |
| S2 | Q | 2 | 16 | 40 | 80 |
| S2 | blank | 1 | none | none | 100 |
| Known concentration (a.u.) | Signal |
|---|---|
| 0 | 2 |
| 2 | 12 |
| 4 | 22 |
| 6 | 32 |
| Card | Assigned concentration (a.u.) | Signal 1 | Signal 2 | Signal 3 |
|---|---|---|---|---|
| Q | unknown | 21 | 22 | 23 |
| QC | 3 | 15 | 16 | 17 |
| L | unknown | 4 | 4 | 4 |
Blind chromatogram readings and detector recovery check
Scope and safety: Draw or print the supplied diagrams; no solvents, drugs, reagents, bodily samples, or unknown household substances.
Materials and preparation
- Paper chromatogram strips drawn to the supplied mm scale; ruler and graph paper.
- Coded Q and QC response records; keep the worked answers and QC key covered.
Procedure and schedule
- Set the origin, band-center convention, comparison tolerance, blank rule, and calibration range before measuring.
- Two readers independently measure the same coded strip. Retain both sets of readings; repeated readings of one strip are not new separations.
- Calculate each replicate’s Rf separately, then means. Compare both bands under S1 before reviewing S2; preserve any change in the candidate set.
- Plot the four calibration standards. Predict Q and QC concentrations before revealing QC’s assigned value; then calculate recovery.
- Write a report including blank/reference status, low-signal limitations, and the distinction between toy agreement and validated identification.
Record: Keep strips, raw paired readings, per-run ratios, plots, reference/blank checks, unknown estimate, QC recovery, and a report with the remaining alternatives.
Worked model
Q’s first S1 band gives 40/100 = 0.40 and 32/80 = 0.40. A and B both fit Q in S1, but S2 gives Q means 0.205 and 0.50, compatible with A and far from B’s 0.60 and 0.80. Detector slope = (32 − 2)/6 = 5; Q mean signal 22 gives (22 − 2)/5 = 4 a.u. QC mean 16 gives 2.8 a.u.; recovery = 2.8/3 × 100 = 93.3333%.
Numerical calibration
- 0.4 mean first-band Rf in S1; dimensionless
- 5 signal units per arbitrary concentration unit
- 4 a.u. in the stated calibration range
- 93.333333 % recovery for the hidden QC card
Attempt the assigned level
Try the tasks before reading the calibration. These are practice answers, not a secure examination; use a new dataset or changed assumption for the assessed transfer.
Foundation
- Label the origin, two bands, solvent front, and phases. Compute Q’s first-band Rf in both S1 runs.
- Plot the detector standards and explain why concentration zero has a nonzero response.
Check after your attempt
- Both ratios are 0.40 even though the front traveled different distances. The supplied blank has no band; an unmarked or zero front would make Rf unusable.
- The line has intercept 2 signal units and slope 5 signal units per a.u. The intercept represents the modeled background response, not target concentration.
High-school core: typically grades 9-10
- Calculate the mean of each band’s replicate ratios for A, B, and Q in each solvent. Report both compatible and excluded references under the prespecified rule.
- Calculate Q’s concentration, replicate range, and QC recovery. Explain the controls required before any identification claim.
Check after your attempt
- S1 means: A and Q (0.40, 0.70); B (0.4175, 0.7175). S2 means: A (0.20, 0.50), B (0.60, 0.80), Q (0.205, 0.50). A remains compatible; B is excluded by S2 within this reference set, not all possible substances.
- Q is 4 a.u., range 3.8–4.2. QC is 2.8 a.u. and 93.3333% recovery, within this exercise’s 90–110% band. Clean blanks and functioning references are necessary but do not themselves validate specificity.
Honors extension: typically grades 11-12
- Given a teaching detection decision threshold of 5 signal units, interpret card L without asserting a zero concentration. Explain a signal of 42 or a zero solvent-front distance.
- Explain why two solvent conditions can strengthen discrimination yet still require validation and may not be statistically independent. Distinguish concentration from a toxicological effect.
Check after your attempt
- L’s signal 4 is below the decision threshold: report not detected at that threshold, not absent. Signal 42 is outside the 0–6 a.u. calibration; do not extrapolate a reportable concentration. A zero solvent front makes the ratio invalid.
- Common matrix effects and shared references can correlate both conditions. Test interferents, matrix controls, detection limits, and held-out materials before professional use. These arbitrary concentrations say nothing about a human dose, timing, or impairment.
History, reading, and writing connection
Cite NIJ’s research goal on interpreting concentration and effect. Write a brief historical comparison of reliance on appearance with instrument-based chemical evidence, using the two co-migrating S1 references to explain why more measurement is not automatically more certainty. Do not invent a real case or medical claim.
Write in your own words or use an approved accessible equivalent. Cite a specific assigned section or figure, identify its evidence, and state one limitation or counterargument. Use the AI practice contract only for permitted coaching, never to invent observations or write the assessed response.
Transfer to a new case
In a fresh run, Q still fits A but the blank contains a band at the same position. Should the report confirm A?
Calibration: No. The control failure makes the affected result invalid for that conclusion. Investigate the cause and repeat an approved clean paper-data scenario; never erase the failed run or treat repeated contaminated measurements as confirmation.
Evidence to retain
Retain labeled phase/band diagrams, both readers’ original distances, replicate Rf table, candidate-set change, standard curve with units, Q range, QC recovery, control decisions, and identification limits.
Record units, calculations, source/date, uncertainty, and what is measured versus inferred. A simulation or supplied dataset must stay labeled as such. Fictional cases only. No real bodily samples, personal fingerprints, suspect profiles, personal-device searches, chemicals, cultivation, firearms, ammunition, or projectiles. Use paper, printed diagrams, and supplied mock data. Synthetic arithmetic checks are not empirical forensic-method validation or classroom pilot evidence.
Return to all eight learning pathways. Print this unit page for the student lessons; the linked five-page packet remains the separate assessment companion.
Unit mastery rubric
| Criterion | Developing | Proficient | Mastery |
|---|---|---|---|
| Chromatography principles & the Rf value | Cannot explain separation or define the ratio. | Computes a ratio without a valid origin/front. | Explains mobile/stationary phases; computes dimensionless per-run Rf values, repeated-reading spread, and invalid-front cases from supplied diagrams. |
| Ink & dye separation | Identifies ink from appearance alone. | Compares one band or solvent only. | Compares two-band mixtures with references across both supplied solvent conditions; retains compatible and excluded references without asserting unique identity. |
| Presumptive vs. confirmatory testing | Treats a screen as a final identification. | Names confirmation but ignores specificity. | Distinguishes screening from validated confirmation; explains co-migration, interference, and why repeating the same screen is not independent confirmation. |
| Analyzing an unknown systematically | Guesses a concentration or identity. | Uses a calibration without blank correction or range checks. | Fits the supplied standard curve, subtracts the blank, calculates unknown concentration and QC recovery, and rejects extrapolation or human-effect claims. |
| Technique, controls & documentation | Omits controls or original readings. | Records controls without acting on failure. | Retains coded paper measurements, independent readings, blank/reference status, and failed runs; distinguishes arithmetic checks from empirical method validation. |
| Integration (cross-domain) | Makes no supported connection between the source and the science. | Uses the source but needs help connecting evidence, writing, or limitations to the science. | Independently connects History, Reading, and Writing using a cited source, appropriate evidence, a limitation, and a scientific explanation. |
Integration is reported separately and cannot lower the science grade or block a science demonstration pass. Science and practical criteria determine that pass. Use the integration guide's evidence checklist for the separately reported criterion.
“A and B both fit Q in S1; only A fits both S2 bands within our rule. That does not identify a unique ink. The detector gives Q = 4 arbitrary units after blank correction; QC recovery is 93.3333%, not evidence of impairment.”
“The colors spread out, so it’s the same pen. The presumptive test turned positive, so that proves what it is.”
Use the supplied paper chromatograms and detector records to model separation, calculate ratios, compare references, and defend controls. Retain blind repeated readings and QC checks. No solvents, substances, or biological samples are assigned; these models do not certify a forensic identification method.
A 5-page clipboard packet — unit overview, key terms, the mastery rubric, anchor examples, and a score sheet you can print and grade against.