Unit 06 · DNA & Biological Evidence
Use fictional STR cards, conceptual DNA/PCR diagrams, and a paper size ladder to explain profiling and its limits. Retain clean-profile exclusions, missing-locus and mixture inconclusives, and failed-control invalid results. Calculate genotype frequencies only under the stated population and independence assumptions. A random-match probability is not guilt, a unique-identity guarantee, or evidence of when or how material arrived.
Student learning: Read fictional profiles without confusing a match statistic with guilt
Choose the level by readiness, not age alone, and record it before instruction. Foundation, core, and honors tasks are study pathways, not an AP course or a promise of college credit. The instructor retains practical assessment and the published science rubric; integration is reported separately.
Prerequisites: Cell/DNA basics, complementary bases, multiplication of probabilities, and Units 2–5 controls and uncertainty.
Suggested sequence: read and discuss the explanation; attempt the worked model; analyze the data at your selected level; check the answers; then complete the source-linked response and a fresh transfer question. These activities supplement, not replace, supervised practical work and the full-year schedule.
Assigned reading and focus
- OpenStax Biology 2e, 17.1: Biotechnology. Read Gel Electrophoresis and Nucleic Acid Fragment Amplification by Polymerase Chain Reaction, including Figures 17.4 and 17.5. Sketch their roles conceptually; do not perform extraction, PCR, or biological sampling.
- NIST: DNA Mixture Interpretations: A Q&A With NIST’s John Butler. Read Why is it important that this data be public? and What can an analyst do to deal with complications? Compare single-source validation with the limits of complex mixtures; retain the article’s 2021 context rather than treating it as a current certification.
Learn the science
DNA contains a sequence of nucleotide bases, with A pairing with T and C with G. A short tandem repeat (STR) locus contains repeated sequence units; inherited repeat counts vary. A typical diploid single-source profile has at most two allele values at an autosomal locus, but a profile is not an entire genome or a statement of conduct.
Extraction separates genetic material, PCR increases copies of selected regions, and electrophoresis separates DNA fragments by migration through a matrix, with size standards for comparison. Smaller fragments usually travel farther under the same conditions. Controls can reveal contamination or failure; repeating PCR does not create a new independent person or source.
In the clean single-source classroom model, a fully observed incompatible allele can exclude a reference. A missing locus is not an absent allele; partial data, degradation, dropout, or a possible mixture demand a different interpretation. The simple table below does not deconvolve mixtures or implement probabilistic genotyping.
Under a deliberately simplified random-mating population model, an unordered heterozygous genotype has frequency 2pq and a homozygous genotype p². Multiply genotype frequencies across loci only when the stated population and independence assumptions hold. Population structure, relatedness, allele uncertainty, and linkage can invalidate the shortcut.
A DNA random-match probability is not the probability of guilt or of an innocent person having left the evidence. It describes a random unrelated profile under the model. The reciprocal is a frequency expression, not automatically a likelihood ratio; a source-level LR requires explicit competing source hypotheses and the probability of this evidence under each.
Sensitive detection can reveal material transferred indirectly or long before an event. Even a strong source association cannot by itself establish when or how deposition occurred. The analyst must retain invalid, excluded, and inconclusive findings and leave legal decisions to the court.

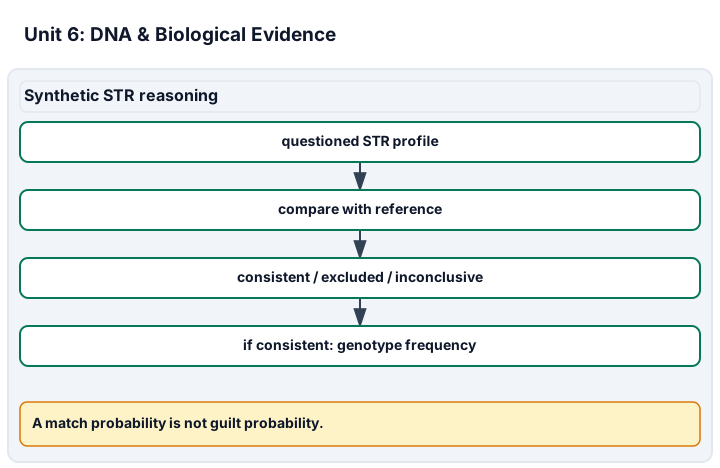
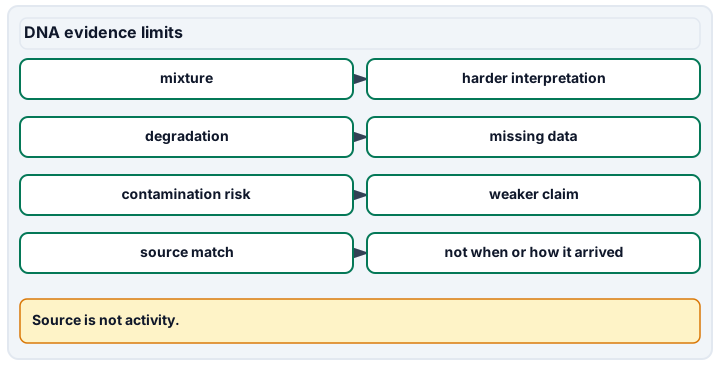
Diagram description
Synthetic STR reasoning compares a questioned profile with a reference, gives outcome categories, and computes genotype frequency only for consistent comparisons. DNA evidence limits describes mixture, degradation, contamination and source-versus-activity limits.
Data, provenance, and assumptions
| Card | L1 alleles | L2 alleles | L3 alleles | Control status |
|---|---|---|---|---|
| reference | 12,14 | 8,10 | 16,16 | pass |
| A | 12,14 | 8,10 | 16,16 | pass |
| B | 12,15 | 8,10 | 16,16 | pass |
| C | 12,14 | missing | 16,16 | pass |
| M | 12,14,15 | 8,10 | 16,16 | pass |
| X | 12,14 | 8,10 | 16,16 | failed |
| Locus | Genotype kind | p | q (unused for homozygous) |
|---|---|---|---|
| L1 | heterozygous | 0.1 | 0.2 |
| L2 | heterozygous | 0.2 | 0.3 |
| L3 | homozygous | 0.4 | 0.4 |
| Fragment length (base pairs) | Migration (mm) |
|---|---|
| 1000 | 20 |
| 500 | 40 |
| 250 | 60 |
Independent profile audit with a concealed comparison key
Scope and safety: Paper alleles and gel drawings only. No DNA collection, cheek swabs, bodily samples, extraction, reagents, or real genetic profiles.
Materials and preparation
- Printed coded profile cards, a paper size ladder, and two decision sheets.
- Calculator and the supplied fictional allele-frequency table.
Procedure and schedule
- Label a conceptual DNA/PCR/gel sequence. Establish controls and the clean single-source comparison assumptions before opening reference cards.
- Readers independently record every visible allele, missing locus, and control failure before comparison. Do not show a fictional accusation or the other reader’s answer.
- Classify A, B, C, M, and X, retaining the evidence for each decision. Reveal the key only after both readers sign their first records.
- Calculate single-locus genotype frequencies and their product. Restate the model before considering how a relative, a mixture, or a failed control would change it.
- Recalculate a separate two-locus scenario where a third reported test is only a repeat of L1. Keep it separate from the original independent L3 calculation.
Record: Retain conceptual sketches, original allele tables, both readers’ decisions, control/missing-data notes, frequency arithmetic with assumptions, and a source-versus-activity limitation.
Worked model
The reference genotype frequencies are 2 × 0.1 × 0.2 = 0.04, 2 × 0.2 × 0.3 = 0.12, and 0.4² = 0.16. Their independent-locus product is 0.000768, about 1 in 1,302.0833 unrelated profiles under this invented model. Among 10,000 such profiles, the expected number of matches is 7.68; an expectation is not an observed count or a guilt probability.
Numerical calibration
- 0.000768 synthetic independent-locus random-match probability
- 1302.083333 reciprocal of the toy RMP; not a guilt statistic
- 7.68 expected matches among 10,000 unrelated profiles
- 0.0048 two-locus probability when a third test only repeats L1
Attempt the assigned level
Try the tasks before reading the calibration. These are practice answers, not a secure examination; use a new dataset or changed assumption for the assessed transfer.
Foundation
- Sketch complementary DNA and the distinct roles of extraction, PCR, and electrophoresis without a wet procedure. Rank the supplied ladder fragments by migration.
- List the missing locus, the more-than-two-allele locus, and the failed-control card before any comparison.
Check after your attempt
- A pairs with T and C with G; extraction isolates, PCR amplifies selected regions, and the gel separates fragments for comparison with a ladder. The 250-base-pair fragment travels farthest and the 1,000-base-pair fragment least.
- C lacks L2, M has three L1 allele values, and X has a failed control. These are different problems; none is repaired by selecting only the alleles that fit the reference.
High-school core: typically grades 9-10
- Apply the full-data rule to each coded card and state the excluded, consistent, inconclusive, and invalid outcomes.
- Calculate the three genotype frequencies and the independent product. Translate the result into words without reversing the conditional probability.
Check after your attempt
- A is consistent, not uniquely identified. B is excluded in the clean complete-profile model. C is inconclusive because L2 is missing; M is inconclusive for this simple method because a mixture or other complication is possible. X is invalid until the control failure is resolved.
- The frequencies are 0.04, 0.12, and 0.16; the product is 0.000768. This is the chance a random unrelated profile has the reference genotype under the stated population model, not the chance a named person is innocent or guilty.
Honors extension: typically grades 11-12
- Find the reciprocal frequency and the expected number of matches in 10,000 unrelated profiles. Explain why a relative is not governed by the same simple assumption.
- For a separate panel with L1 and L2 only, calculate the probability if the third test merely repeats L1. Compare with multiplying all three reported tests.
Check after your attempt
- The reciprocal is about 1,302.0833 and the expected count is 7.68, not a guarantee of exactly seven or eight matches. Relatives share inherited alleles, and the unrelated-population shortcut is inappropriate.
- A duplicate L1 contributes no new independent locus: 0.04 × 0.12 = 0.0048. The naive 0.04 × 0.12 × 0.04 = 0.000192 double-counts evidence. This duplicate-panel exercise is separate from the original three independent loci and cannot be converted into guilt.
History, reading, and writing connection
Cite Butler’s 2021 discussion of public validation data and compare it with the assigned OpenStax diagrams. Explain how increasing sensitivity can make interpretation harder rather than simply more certain. Connect this methodological history to the C/M/X limitations, with a student-authored source-cited paragraph rather than a real suspect story.
Write in your own words or use an approved accessible equivalent. Cite a specific assigned section or figure, identify its evidence, and state one limitation or counterargument. Use the AI practice contract only for permitted coaching, never to invent observations or write the assessed response.
Transfer to a new case
A new questioned card has one missing allele after a weak signal. May you exclude it solely because the reference has two alleles?
Calibration: No. A missing observed allele may be dropout, not a true genetic difference. Record an inconclusive result under this simple method, review controls and signal quality, and require an appropriate validated interpretation rather than forcing the full-profile rule.
Evidence to retain
Submit the process/ladder sketches, full allele/control table, independent comparison records, all outcome categories, genotype calculations, independence/relatedness assumptions, and a report separating source, activity, and guilt.
Record units, calculations, source/date, uncertainty, and what is measured versus inferred. A simulation or supplied dataset must stay labeled as such. Fictional cases only. No real bodily samples, personal fingerprints, suspect profiles, personal-device searches, chemicals, cultivation, firearms, ammunition, or projectiles. Use paper, printed diagrams, and supplied mock data. Synthetic arithmetic checks are not empirical forensic-method validation or classroom pilot evidence.
Return to all eight learning pathways. Print this unit page for the student lessons; the linked five-page packet remains the separate assessment companion.
Unit mastery rubric
| Criterion | Developing | Proficient | Mastery |
|---|---|---|---|
| DNA structure & STR profiling | Confuses bases, alleles, and loci. | Describes variation but assumes every profile is unique. | Explains complementary DNA and inherited STR variation using fictional loci, distinguishing a profile from a whole genome or an identity guarantee. |
| Extraction, PCR & electrophoresis | Cannot outline the conceptual process. | Confuses amplification and size separation. | Explains extraction, PCR, controls, and electrophoresis with paper diagrams and a size ladder, without biological sampling or wet procedures. |
| Reading a profile & comparison | Selects only agreeing alleles. | Compares complete cards but forces a partial or mixture. | Records alleles independently before comparison; distinguishes consistent, excluded, partial/mixture inconclusive, and failed-control invalid outcomes under the stated model. |
| Match probability & statistics | Reports a probability of guilt from a match. | Multiplies frequencies without checking assumptions. | Calculates toy genotype frequencies and random-match probability; states population/independence assumptions, rejects duplicate-locus multiplication, and never equates RMP with guilt. |
| Sample integrity | Ignores contamination or missing data. | Notices defects but reports a firm source claim. | Explains contamination, degradation, dropout, relatedness, and transfer limitations; retains failed controls and separates source association from time or activity. |
| Integration (cross-domain) | Makes no supported connection between the source and the science. | Uses the source but needs help connecting evidence, writing, or limitations to the science. | Independently connects History, Reading, and Writing using a cited source, appropriate evidence, a limitation, and a scientific explanation. |
Integration is reported separately and cannot lower the science grade or block a science demonstration pass. Science and practical criteria determine that pass. Use the integration guide's evidence checklist for the separately reported criterion.
“The fictional independent-locus product is 0.000768, about 1 in 1,302 unrelated profiles under the model. C and M are inconclusive here, X invalid. Repeating L1 adds no independent locus, and no RMP tells us guilt or how material arrived.”
“The DNA matches, so it’s a 100% match — it proves he did it.”
Use fictional paper STR profiles and a supplied ladder. Retain independent allele records, comparisons, controls, exclusions, and inconclusives. Defend frequency calculations and their assumptions without real genetic data, wet procedures, or an implication that RMP measures guilt.
A 5-page clipboard packet — unit overview, key terms, the mastery rubric, anchor examples, and a score sheet you can print and grade against.