Unit 07 · Ballistics & Toolmarks
The professional-discipline title frames a paper-only study of class/fine-mark diagrams, synthetic profile comparisons, paired-reader errors, and an ideal two-dimensional line. No firearms, ammunition, tools, or projectiles are used. Compare observed joint errors with an independence assumption, retain missing features, and bound the drawing’s geometry without claiming unique identity or a physical trajectory reconstruction.
Student learning: Measure paper marks and test the independence of verification
Choose the level by readiness, not age alone, and record it before instruction. Foundation, core, and honors tasks are study pathways, not an AP course or a promise of college credit. The instructor retains practical assessment and the published science rubric; integration is reported separately.
Prerequisites: Unit 2 error tables, Unit 5 geometric assumptions, slope, and degree-mode inverse tangent.
Suggested sequence: read and discuss the explanation; attempt the worked model; analyze the data at your selected level; check the answers; then complete the source-linked response and a fresh transfer question. These activities supplement, not replace, supervised practical work and the full-year schedule.
Assigned reading and focus
- NIST: Firearms and Toolmarks. Read Goal, Why is NIST involved in Firearms and Toolmarks?, and What is NIST doing? Focus on measurement standards, objective comparisons, and uncertainty. No operational firearm procedure or physical weapon work is assigned.
- NIST: Human Factors in Latent Print Analysis. Revisit the third and fourth introductory paragraphs on reducing error through human-factors research. Identify why a second opinion can share the same sources of error as the first.
Learn the science
The historical unit title names a professional discipline; this student work is entirely paper-based. A firearm/cartridge diagram can distinguish a bullet, case, and the different surfaces examined without showing how to operate, construct, or test a weapon. No firearms, ammunition, spent cases, launchers, or projectiles enter the activity.
Rifling and other manufacturing features can produce class characteristics; contact and wear can create finer toolmarks. Similarity alone does not establish uniqueness. Subclass manufacturing similarities and damage can complicate comparison. Use supplied drawn marks, not real marks or operational firing instructions.
Our toy profiles are heights at four fixed x positions, in arbitrary diagram units. A clear same-class profile with each position within 0.2 of the reference is consistent; a clear class or large profile disagreement excludes it under this toy rule. A missing feature is inconclusive, not an automatically discordant mark.
Blind readers record their measurements without earlier conclusions. They may still share an ambiguous feature or training bias. Conditional independence of errors given the known source relationship is a stronger claim than the fact that two people worked separately.
The paired-reader table contains only known different-source trials. A positive means an erroneous same-source call. Joint false positives are counted directly; multiplying the marginal error rates is appropriate only with a defensible conditional-independence model. Here the joint count deliberately violates that model.
The geometry table is a 2D straight line drawn on paper: y = 0.4x + 2. Slope is rise/run, and arctan(slope) is its angle to the x axis. It is not a model of projectile flight, speed, energy, gravity, or a real firing position; those cannot be inferred from this drawing.

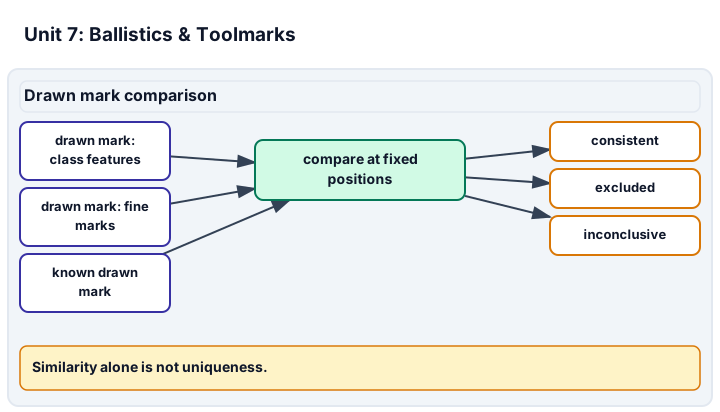
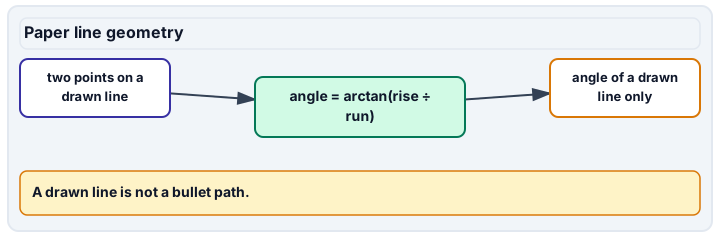
Diagram description
Drawn mark comparison uses class features, fine marks and a known drawn mark as inputs to a fixed-position comparison with consistent / excluded / inconclusive outcomes. Paper line geometry computes the angle of a drawn line from two points and explicitly states it is angle of a drawn line only.
Data, provenance, and assumptions
| Schematic label | Compared surface | Interpretive distinction |
|---|---|---|
| bullet diagram | drawn rifling-impression surface | class geometry versus finer marks |
| cartridge-case diagram | drawn base-impression surface | different surface from bullet rifling |
| generic toolmark diagram | drawn contact profile | manufacturing class or subclass similarity versus wear detail |
| Card | Class label | Height 1 | Height 2 | Height 3 | Height 4 |
|---|---|---|---|---|---|
| reference | G1 | 1 | 4 | 2 | 5 |
| Q1 | G1 | 1.1 | 3.9 | 2.1 | 5 |
| Q2 | G2 | 1 | 4 | 2 | 5 |
| Q3 | G1 | 1 | 4 | ? | 5 |
| Reader A | Reader B | Paired trials |
|---|---|---|
| + | + | 3 |
| + | - | 1 |
| - | + | 1 |
| - | - | 75 |
| x (cm) | y (cm) |
|---|---|
| 0 | 2 |
| 10 | 6 |
| 20 | 10 |
Independent profile readings and a dependence audit
Scope and safety: Paper grids, supplied diagrams, and calculators only; no tools pressed into material, firearms, ammunition, projectiles, or physical trajectory reconstruction.
Materials and preparation
- Schematic label boxes from the supplied surface key, plus coded paper profiles and a reference drawn from the table.
- Two original measurement sheets, a hidden code key, ruler, and calculator.
Procedure and schedule
- Draw the three separate surface-label boxes from the supplied key and explain class versus finer detail without a mechanism or procedure. Set the toy comparison rule and uncertainty before reading profiles.
- Each reader separately marks and measures the four positions. Note the missing position in Q3; do not invent a height to complete the profile.
- Lock both comparison decisions before the key is revealed. Compare disagreements without replacing the original record.
- Analyze the separate paired-reader table using both observed joint frequencies and a hypothetical independent-error model. Explain the mismatch.
- Plot the paper line and bound its slope/angle from the endpoints. Reject unsupported claims about a projectile or a person’s position.
Record: Retain labeled profile overlays, two pre-discussion reading sheets, all decision categories, the joint-error calculation, conditional-error comparison, and a bounded paper-line plot.
Worked model
Both readers err in 3/80 trials = 3.75%. Each reader individually errs in 4/80 = 5%. Multiplying 0.05 × 0.05 would predict only 0.25%, not the observed 3.75%. Given A erred, B also erred in 3/4 = 75%. Separately, the paper-line slope is (10 − 2)/20 = 0.4 and angle arctan(0.4) ≈ 21.8014°.
Numerical calibration
- 3.75 % observed joint errors in the synthetic table
- 0.25 % predicted by the contradicted independence assumption
- 75 % B errors among the four A-error trials
- 0.4 cm/cm on the ideal paper line
- 21.801409 degrees to the paper x axis
- 19.290046 degrees; lower reading bound
- 24.227745 degrees; upper reading bound
Attempt the assigned level
Try the tasks before reading the calibration. These are practice answers, not a secure examination; use a new dataset or changed assumption for the assessed transfer.
Foundation
- Draw the reference’s four heights and name the distinction between class and finer contact features. Identify the missing feature rather than filling it in.
- Count each reader’s errors and shared errors. Plot the three paper-line points with units.
Check after your attempt
- Q1 is close at all positions and in the same class; Q2’s matching heights do not undo its class disagreement. Q3 has no readable third height. These features belong to fictional diagrams, not identified tools.
- A errs 4 times, B errs 4 times, and 3 of those trials are shared, out of 80 trials total. The line passes through (0,2), (10,6), and (20,10); its intercept is 2 cm.
High-school core: typically grades 9-10
- Apply the toy profile rule; retain consistency, exclusion, and inconclusive outcomes with reasons.
- Compute marginal and observed joint error rates, and derive the paper-line slope and angle. Explain what neither calculation establishes.
Check after your attempt
- Q1 is consistent within 0.2; Q2 excluded on the clear G2/G1 class difference; Q3 is inconclusive because a position is unreadable. Consistency is not a unique source identification or a percentage confidence.
- Marginals are 5% for each reader and observed joint error is 3.75%, not 0.25%. The paper slope is 0.4 and its angle about 21.8014°. These invented results do not establish professional error rates or any real trajectory.
Honors extension: typically grades 11-12
- Calculate P(B error | A error) and compare it with P(B error) on known different-source trials. Propose a study that measures rather than assumes conditional independence.
- Bound the paper line’s angle using the extreme endpoint readings and state why those bounds are not a confidence interval or a physical reconstruction.
Check after your attempt
- The conditional fraction is 3/4 = 75%, versus marginal 4/80 = 5%. Here blinding does not establish independence; shared images or methods can correlate errors. A study needs representative known-source pairs, independently recorded decisions, repeat/reader clustering, and joint outcomes.
- Endpoint slopes range from (9.5 − 2.5)/20 = 0.35 to (10.5 − 1.5)/20 = 0.45; angles ≈ 19.2900°–24.2277°. These are worst-case bounds under an exact-x straight-line model, not statistical confidence bounds or evidence of a firing position.
History, reading, and writing connection
Cite NIST’s explanation of the transition from subjective comparison toward objective measurement standards. Write a short historical-methods memo using the 3.75% versus 0.25% discrepancy to explain why review safeguards must be tested. Do not describe the invented counts as NIST findings.
Write in your own words or use an approved accessible equivalent. Cite a specific assigned section or figure, identify its evidence, and state one limitation or counterargument. Use the AI practice contract only for permitted coaching, never to invent observations or write the assessed response.
Transfer to a new case
A fresh third point is (20,13) cm with the same ±0.5 cm y bound; the first two points remain unchanged. May all three be reported as one measured straight line?
Calibration: Not within those bounds. At x=10, a straight line between x=0 and x=20 would have y at least (1.5+12.5)/2 = 7 cm, above the second interval’s upper endpoint of 6.5 cm. Recheck the measurements and reject the single-line interpretation rather than force the old model.
Evidence to retain
Submit the diagram-based class/fine-feature explanation, paired measurements, candidate decisions, two-by-two reader table, marginal/joint/conditional error rates, line plot with bounds, and limits on source/trajectory claims.
Record units, calculations, source/date, uncertainty, and what is measured versus inferred. A simulation or supplied dataset must stay labeled as such. Fictional cases only. No real bodily samples, personal fingerprints, suspect profiles, personal-device searches, chemicals, cultivation, firearms, ammunition, or projectiles. Use paper, printed diagrams, and supplied mock data. Synthetic arithmetic checks are not empirical forensic-method validation or classroom pilot evidence.
Return to all eight learning pathways. Print this unit page for the student lessons; the linked five-page packet remains the separate assessment companion.
Unit mastery rubric
| Criterion | Developing | Proficient | Mastery |
|---|---|---|---|
| Firearm & cartridge basics | Confuses the surfaces shown in diagrams. | Names diagram parts but confuses class and finer marks. | Distinguishes bullet/case surfaces and class/contact marks in supplied diagrams only; no weapon handling, operation, ammunition, or projectile activities. |
| Rifling & striation comparison | Compares unaligned or unscaled drawings. | Notes agreement but ignores missing detail. | Aligns supplied profile drawings at fixed positions, retains independent readings, and reports observed correspondence and unreadable detail with scale. |
| Toolmark comparison & its limits | Claims a unique source from similarity. | States consistency without the rule or alternatives. | Applies a stated paper-profile rule, retaining consistency, exclusion, and inconclusive outcomes without unvalidated confidence or identification probabilities. |
| Trajectory & the physics of the scene | Infers a firing position from a drawing. | Computes a slope without uncertainty or assumptions. | Calculates slope, angle, and reading bounds for an ideal 2D paper line; explains why it is not a physical trajectory reconstruction. |
| Technique & documentation | Copies a prior decision or loses original readings. | Uses blind review but assumes independent errors. | Retains blind first decisions and paired-reader outcomes; compares observed joint errors with marginal products and tests conditional-independence assumptions. |
| Integration (cross-domain) | Makes no supported connection between the source and the science. | Uses the source but needs help connecting evidence, writing, or limitations to the science. | Independently connects History, Reading, and Writing using a cited source, appropriate evidence, a limitation, and a scientific explanation. |
Integration is reported separately and cannot lower the science grade or block a science demonstration pass. Science and practical criteria determine that pass. Use the integration guide's evidence checklist for the separately reported criterion.
“Q1 is consistent, Q2 excluded, and Q3 inconclusive in the paper model. Joint errors occur in 3/80 trials, or 3.75%, not the 0.25% obtained by wrongly multiplying the marginal rates. Separate readers can share ambiguous features.”
“The marks look the same, so it’s definitely the same gun — that proves he fired it.”
Compare paper profile drawings and a two-dimensional line, retaining initial blind measurements and uncertainty. Explain class/fine-mark concepts through diagrams only. No firearms, ammunition, real toolmark production, or projectiles are used. Defend the difference between independently recorded decisions and statistically independent errors.
A 5-page clipboard packet — unit overview, key terms, the mastery rubric, anchor examples, and a score sheet you can print and grade against.