Unit 01 · Cells, Tissues & the Body Plan
This unit builds from the single cell outward: what makes the cell the basic unit of life, the four primary tissues and how to tell them apart under the microscope, how those tissues stack into organs and systems, and the shared map — anatomical position, directional terms, planes, and cavities — that lets you say exactly where a structure sits. Mastery means you can identify a tissue on a slide and defend the call, not just recognize a labeled diagram.
Declare the level and observation mode before instruction: approved prepared-slide work or a source-identified image/model alternative. Assess only visible features and the selected calculations. Image work does not certify microscope handling. The learning tasks are practice within these five science criteria, not an additional required practical.
Student learning: Read tissue evidence, calibrate scale, and explain osmotic compartments
Choose the level by readiness, not age alone, and record it before instruction. Foundation, core, and honors tasks are study pathways, not an AP course or a promise of college credit. The instructor retains practical assessment and the published science rubric; integration is reported separately.
Prerequisites: Cell parts, length and volume units, ratios, and the difference between an observation and a model. Honors uses conservation of solute and surface-area-to-volume ratios.
Suggested sequence: read and discuss the explanation; attempt the worked model; analyze the data at your selected level; check the answers; then complete the source-linked response and a fresh transfer question. These activities supplement, not replace, supervised practical work and the full-year schedule.
Assigned reading and focus
- OpenStax Anatomy & Physiology 2e, 1.6: Anatomical Terminology. Use the anatomical-position, directional-terms, cavity, and plane figures. Annotate a supplied body diagram, not a classmate.
- OpenStax Anatomy & Physiology 2e, 3.1: The Cell Membrane. Read Transport across the Cell Membrane, especially diffusion, osmosis, and active transport. Identify the energy source and the membrane boundary in each example.
- OpenStax Anatomy & Physiology 2e, 4.2: Epithelial Tissue. Compare simple and stratified epithelia and cell junctions. Identify which images are micrographs and which are explanatory drawings; neither is a student observation.
- OpenStax Anatomy & Physiology 2e, 4.3: Connective Tissue Supports and Protects. Compare cartilage cells in matrix and fibrous tendon organization with the licensed atlas fields. Separate preparation effects and visible architecture from material properties requiring other evidence.
- OpenStax Anatomy & Physiology 2e, 4.4: Muscle Tissue and Motion. Compare the skeletal, cardiac, and smooth muscle accounts with all three atlas photographs. Do not infer contraction, electrical activity, or molecular structure from a preserved field alone.
- OpenStax Anatomy & Physiology 2e, 4.5: Nervous Tissue Mediates Perception and Response. Read neuronal and neuroglial roles, then inspect the source spinal-cord smear. A soma and processes do not independently identify the motor target, every supporting-cell subtype, or conduction speed.
Learn the science
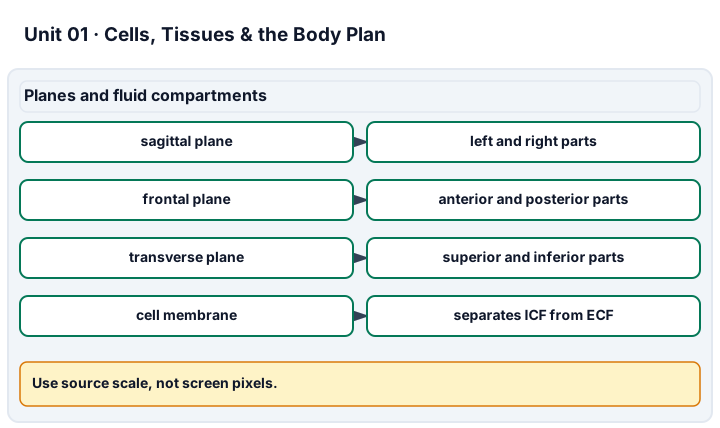
Anatomical descriptions use the subject’s right and left and a standard anatomical position even when a drawing is rotated. Sagittal divides left from right, frontal divides anterior from posterior, and transverse divides superior from inferior. The dorsal cavity contains the brain and spinal cord; the ventral cavities contain many thoracic and abdominopelvic organs. The kidneys are retroperitoneal, not floating inside the peritoneal cavity.
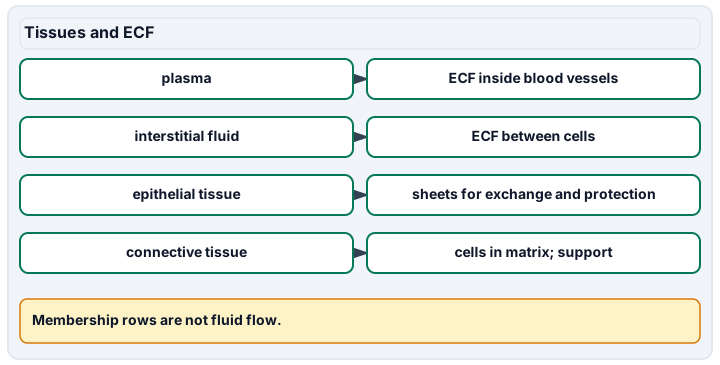
A cell membrane separates intracellular fluid from extracellular fluid. The latter includes interstitial fluid and plasma; plasma is inside blood vessels but still outside blood cells. A cardiac muscle cell belongs to muscle tissue, which joins connective, epithelial, and nervous tissues in the heart. An organ is not made of just one tissue type.
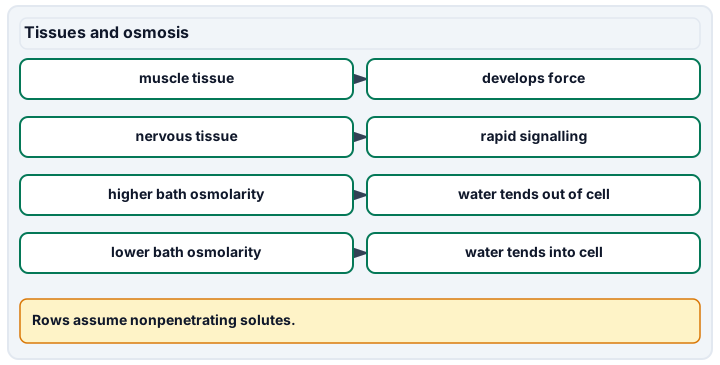
Epithelia form closely joined sheets and regulate exchange; connective tissues contain cells in an extracellular matrix that supports, binds, or transports; muscle develops force; nervous tissue handles rapid information. Thin simple squamous epithelium supports diffusion at alveoli, whereas stratified squamous epithelium resists abrasion. A cuboidal kidney-tubule epithelium can combine an apical surface facing filtrate with a basal surface facing interstitial fluid.
A prepared light micrograph may show nuclei, cell boundaries, layers, striations, and matrix if its stain, resolution, and plane of section support them. It does not reliably reveal membrane channels, ribosomes, or every organelle. A labeled illustration supplies a model of those structures, not proof they were observed. Enlarging an image increases magnification, not resolution. Record “not resolved” rather than inventing a feature.
Water crosses a permeable membrane in response to differences in water chemical potential. In this ideal model it moves toward the higher concentration of nonpenetrating solutes until their concentrations match. Osmolarity counts dissolved particles per litre of solution; tonicity describes the sustained effect of nonpenetrating solutes on cell volume. A penetrating solute can raise measured osmolarity without maintaining the same volume effect. Osmolality, used often in physiology, is particles per kilogram of solvent; these are not identical units.
For an ideal cell in a large bath, assume water moves, solute cannot cross, solute amount stays constant, and membrane tension is negligible. Then C_initial × V_initial = C_bath × V_final. Real cells regulate volume, may rupture, and are not ideal bags. The arithmetic predicts a model trend, not what to put into a person or a cell culture.
Histology reference atlas: see, compare, and bound the claim
Nine actual light micrographs support independent, reference-permitted tissue comparison. This is labeled study material, not a diagnostic atlas and not an unseen identification test. Descriptions separate visible features from source identifications and physiological inferences. Tissue families coexist in organs; a round lumen alone does not identify a kidney or thyroid. Use the separate synthetic scale-bar dataset for measurement practice. Source-image work does not demonstrate slide preparation or microscope handling.
Surface view: simple squamous epithelial sheet
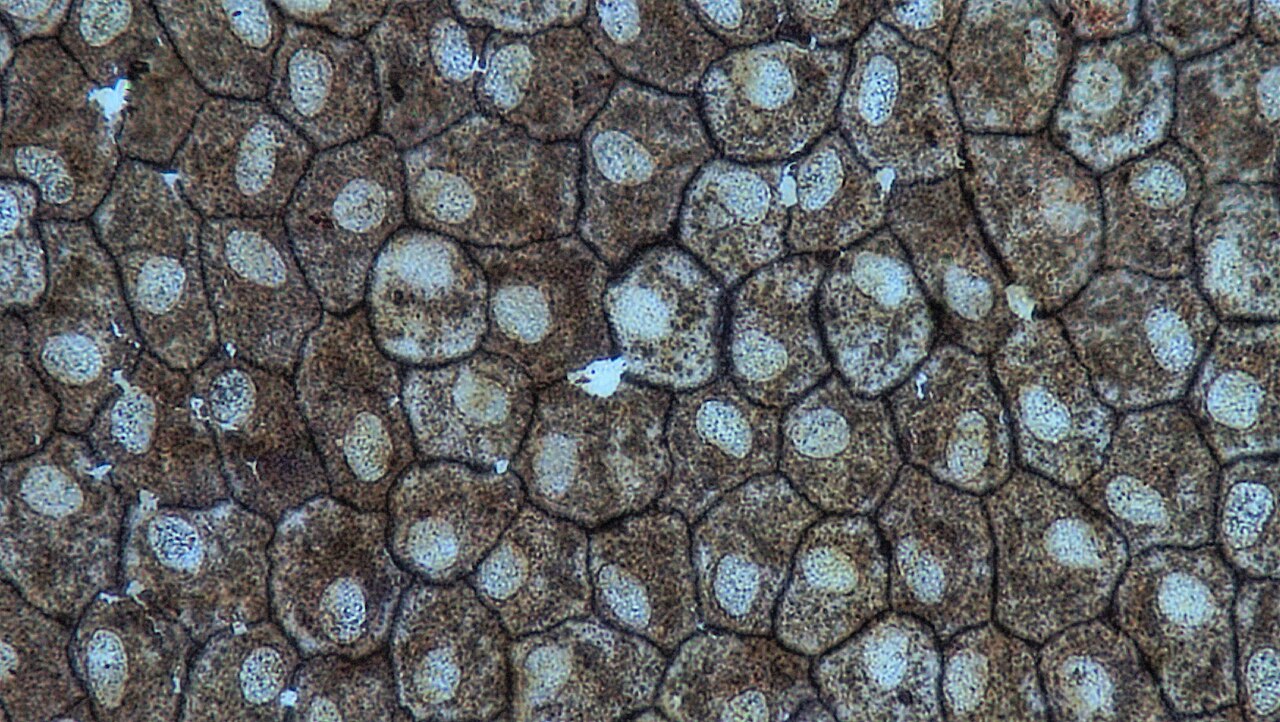
Source: Epithelial Tissues: Simple Squamous Epithelium; original source record.
Creator: Berkshire Community College Bioscience Image Library. License: CC0-1.0. Open the full image.
Preparation: Source: whole mount of human epithelium; stain and precise sampling site not reported.
Source magnification: 400× in the source description
Scale and measurement: 400× in the source description. No calibrated scale bar is supplied in this displayed image. The source magnification is historical acquisition metadata, not a calibration of screen or printed pixels; do not calculate cell size from it.
Image changes: Wikimedia 1280-pixel display derivative; no local cropping, color changes, labels, or generated replacement. The image is reduced for display, not newly measured.
Visible features to compare:
- Adjacent polygonal cell boundaries form a nearly continuous sheet with little visible space between cells.
- Broad cell faces and nuclear profiles can be compared across the field; this is a surface view rather than a cross section through a wall.
Interpretation limits: The source identifies simple squamous epithelium, but this surface view alone cannot count layers or establish diffusion rate. It is not specifically identified as an alveolar sample. Compare its view direction with the kidney sections before making a thickness claim.
Kidney tubules: cuboidal epithelial walls
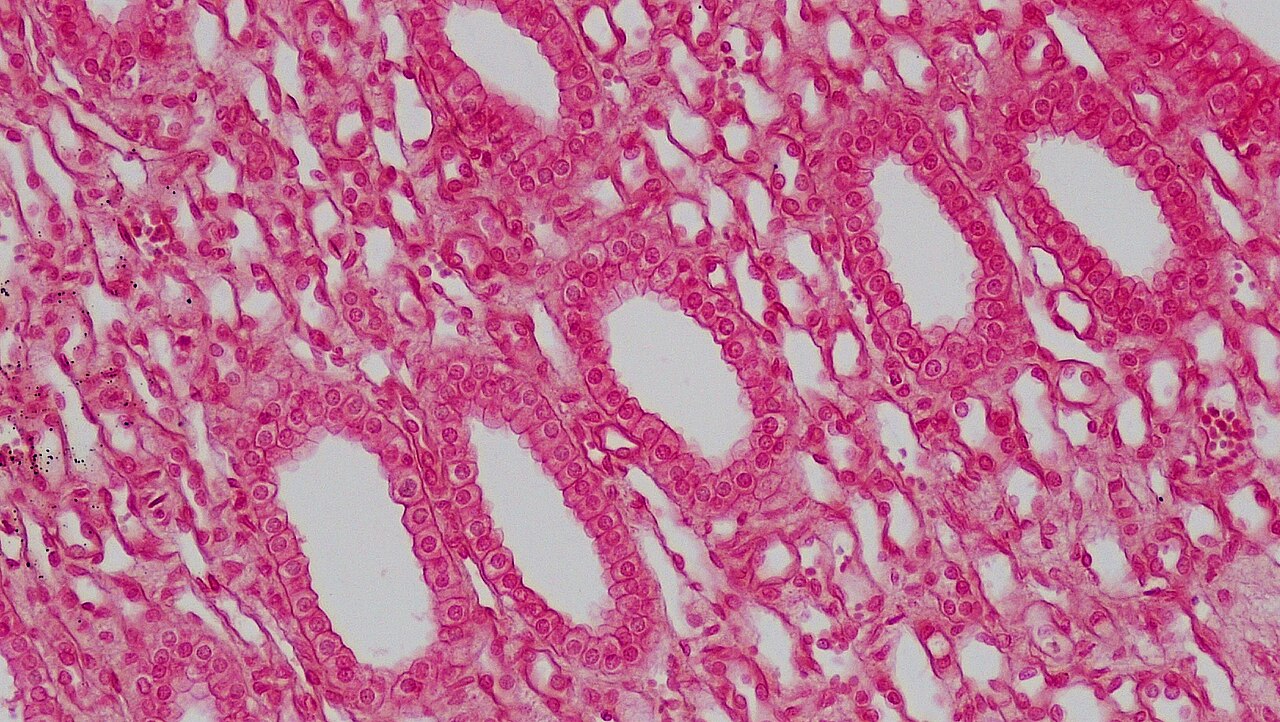
Source: Epithelial Tissues: Simple Cuboidal Epithelium; original source record.
Creator: Berkshire Community College Bioscience Image Library. License: CC0-1.0. Open the full image.
Preparation: Source: cross section of kidney tubule; species and stain not stated in the supplied description.
Source magnification: 200× in the source description
Scale and measurement: 200× in the source description. No calibrated scale bar is supplied in this displayed image. The source magnification is historical acquisition metadata, not a calibration of screen or printed pixels; do not calculate cell size from it.
Image changes: Wikimedia 1280-pixel display derivative; no local cropping, color changes, labels, or generated replacement. The image is reduced for display, not newly measured.
Visible features to compare:
- Tubular lumens are bordered by a roughly single ring of box-like cells with rounded nuclear profiles.
- Different section angles give circular, oval, and elongated lumens in the same field.
Interpretation limits: The source identifies kidney tubules, not a measured filtration rate or a specific transporter. Do not assign SGLT1 versus SGLT2, proximal versus distal identity, or membrane polarity from color alone. Compare the mostly open lumens with the thyroid follicles.
Thyroid: colloid-filled follicles, not renal tubules
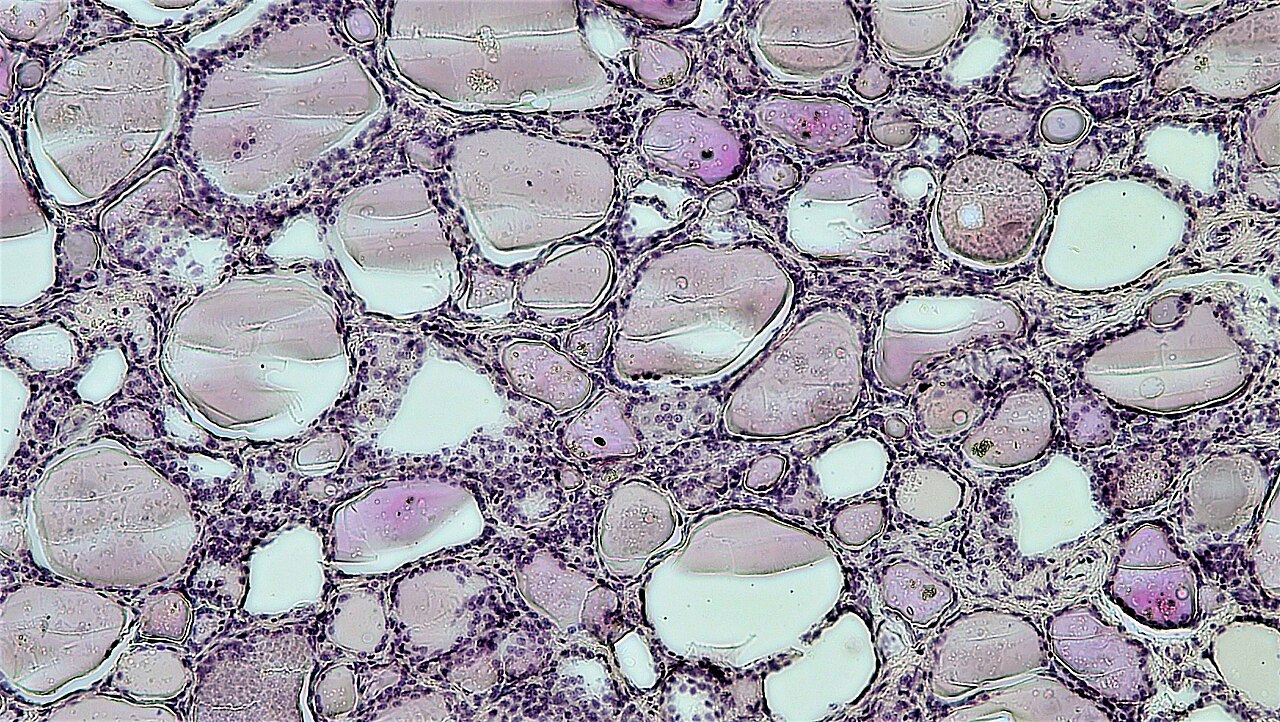
Source: Colloid Filled Lumens in Human Thyroid Gland; original source record.
Creator: Berkshire Community College Bioscience Image Library. License: CC0-1.0. Open the full image.
Preparation: Source: human thyroid gland cross section; hematoxylin and eosin stain.
Source magnification: 100× in the source description
Scale and measurement: 100× in the source description. No calibrated scale bar is supplied in this displayed image. The source magnification is historical acquisition metadata, not a calibration of screen or printed pixels; do not calculate cell size from it.
Image changes: Wikimedia 1280-pixel display derivative; no local cropping, color changes, labels, or generated replacement. The image is reduced for display, not newly measured.
Visible features to compare:
- Many closed-looking profiles contain relatively homogeneous pale material, described as colloid by the source.
- A cellular border surrounds each follicle; several sizes and section profiles are present.
Interpretation limits: Colloid and overall architecture support the source thyroid identification, but staining does not measure thyroid hormone output. Clear margins and cracks may reflect preparation. Do not equate a large follicle with a diagnosis or a measured activity state.
Developing hyaline cartilage: cells in matrix
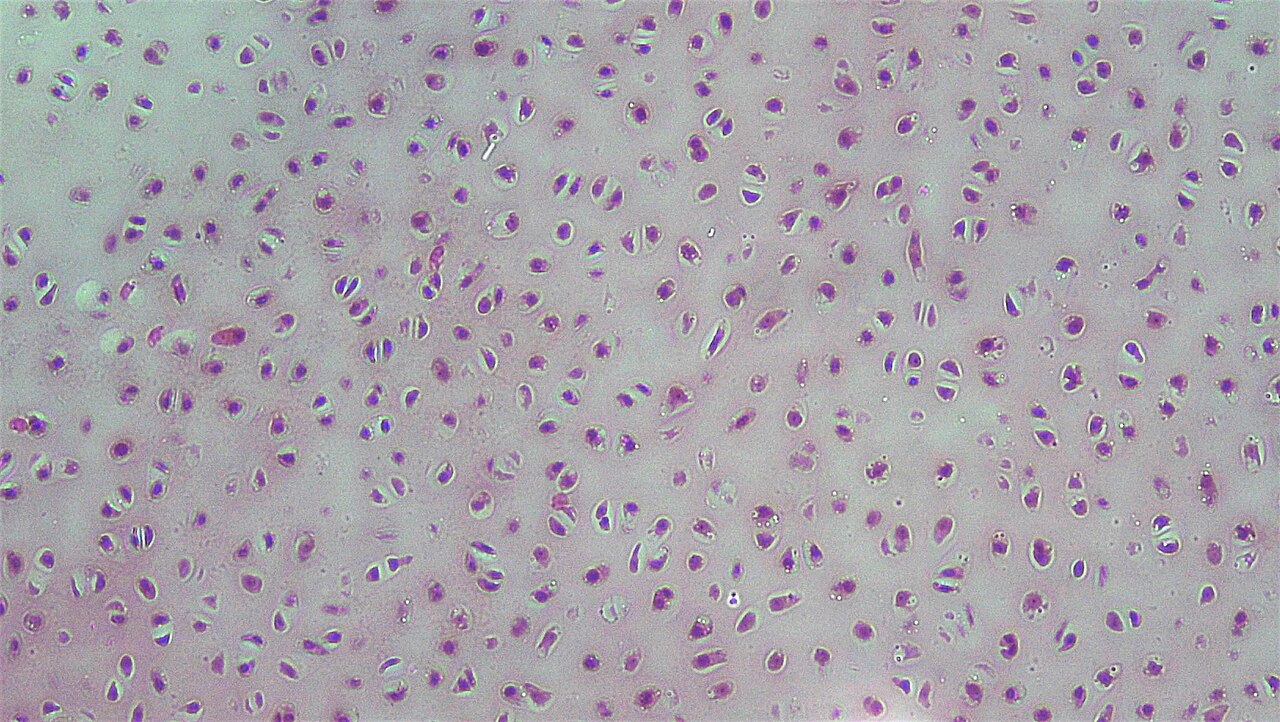
Source: Connective Tissue: Developing Hyaline Cartilage; original source record.
Creator: Berkshire Community College Bioscience Image Library. License: CC0-1.0. Open the full image.
Preparation: Source: hyaline cartilage cross section; species, stain, and developmental age not stated.
Source magnification: 200× in the source description
Scale and measurement: 200× in the source description. No calibrated scale bar is supplied in this displayed image. The source magnification is historical acquisition metadata, not a calibration of screen or printed pixels; do not calculate cell size from it.
Image changes: Wikimedia 1280-pixel display derivative; no local cropping, color changes, labels, or generated replacement. The image is reduced for display, not newly measured.
Visible features to compare:
- Rounded chondrocyte profiles lie in spaces within a matrix rather than forming a continuous luminal sheet.
- Some cells occur as pairs or small neighboring groups; matrix separates these groups.
Interpretation limits: The source names developing hyaline cartilage; the field does not establish a developmental age, growth rate, or mechanical strength. Collagen composition is not determined from this light image, and shrinkage can change the apparent space around a cell.
Teased tendon: fibrous extracellular support
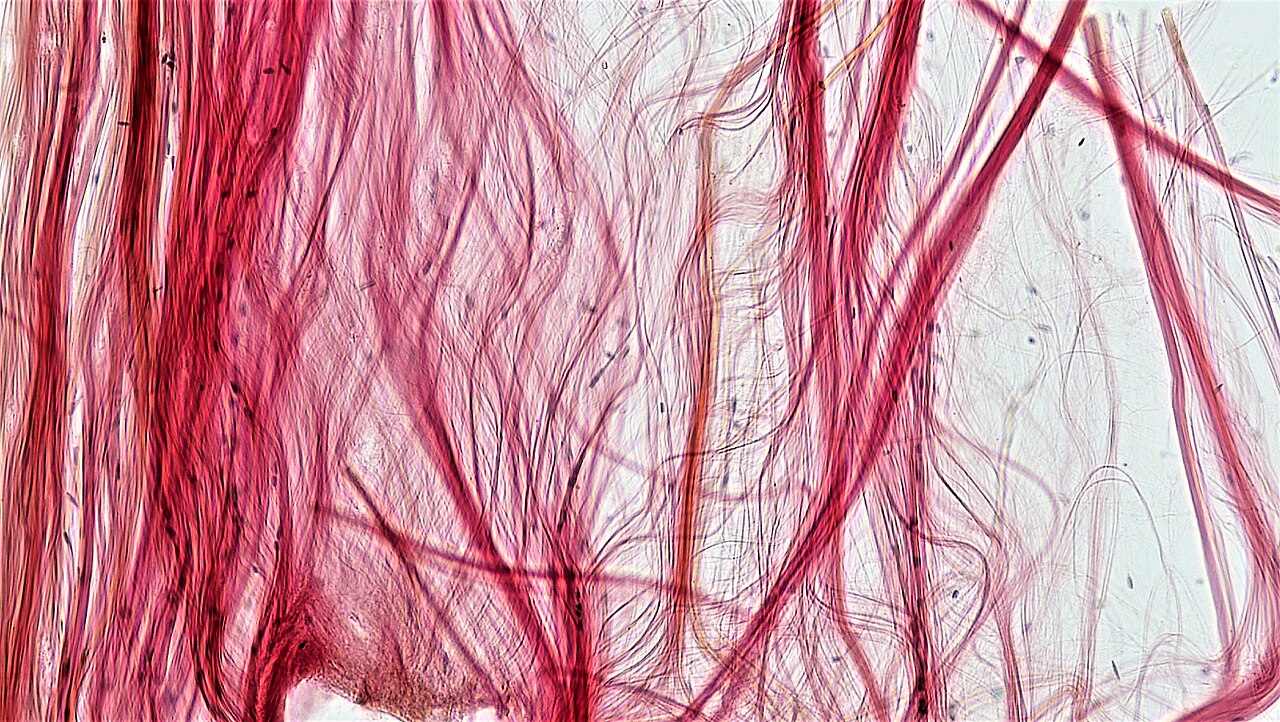
Source: Connective Tissue: Tendon; original source record.
Creator: Berkshire Community College Bioscience Image Library. License: CC0-1.0. Open the full image.
Preparation: Source: teased tendon; species and stain not reported. Teasing separates bundles and alters their original arrangement.
Source magnification: 100× in the source description
Scale and measurement: 100× in the source description. No calibrated scale bar is supplied in this displayed image. The source magnification is historical acquisition metadata, not a calibration of screen or printed pixels; do not calculate cell size from it.
Image changes: Wikimedia 1280-pixel display derivative; no local cropping, color changes, labels, or generated replacement. The image is reduced for display, not newly measured.
Visible features to compare:
- Long fibrous bundles dominate the field, contrasting with the cell-rich kidney lining.
- Fine strands are separated and splayed by the teased preparation; several remaining bundles are approximately parallel.
Interpretation limits: Teasing changes the original arrangement, so this is not a load-bearing cross-sectional measurement. The source identifies tendon, but collagen tensile strength and individual living-cell behavior are not measured. Sparse nuclei should not be counted as all cells originally present.
Skeletal muscle: long striated fibers
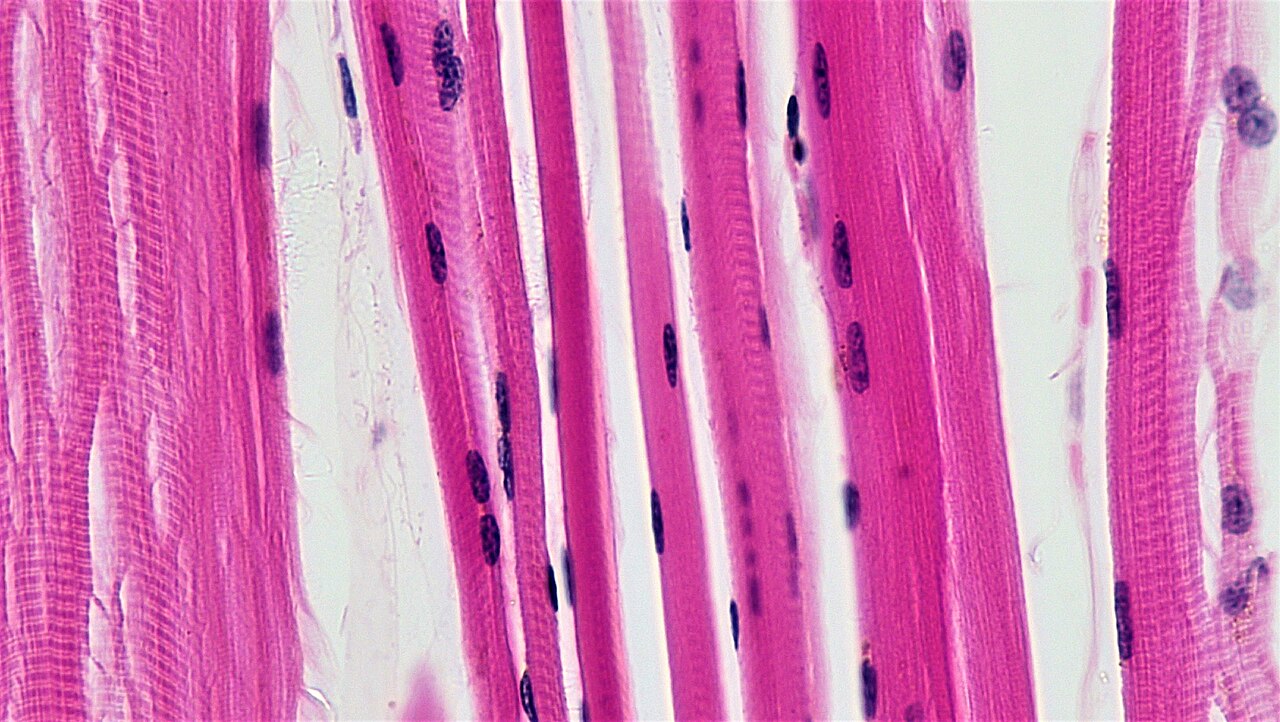
Source: Skeletal Muscle Tissue; original source record.
Creator: Berkshire Community College Bioscience Image Library. License: CC0-1.0. Open the full image.
Preparation: Source calls this a cross section, but displayed fibers run lengthwise with striations. Record this orientation discrepancy; species and stain are not stated.
Source magnification: 200× in the source description
Scale and measurement: 200× in the source description. No calibrated scale bar is supplied in this displayed image. The source magnification is historical acquisition metadata, not a calibration of screen or printed pixels; do not calculate cell size from it.
Image changes: Wikimedia 1280-pixel display derivative; no local cropping, color changes, labels, or generated replacement. The image is reduced for display, not newly measured.
Visible features to compare:
- Long, mostly parallel fiber profiles show repeated light-dark banding across their width.
- Several elongated nuclear profiles are close to fiber edges; the fibers extend beyond the field.
Interpretation limits: Visible lengthwise fibers conflict with the source description of a cross section; retain that discrepancy rather than claiming the metadata proves orientation. A static field cannot show contraction, count every nucleus in a whole fiber, or resolve individual actin and myosin molecules.
Cardiac muscle: striations and junctional bands
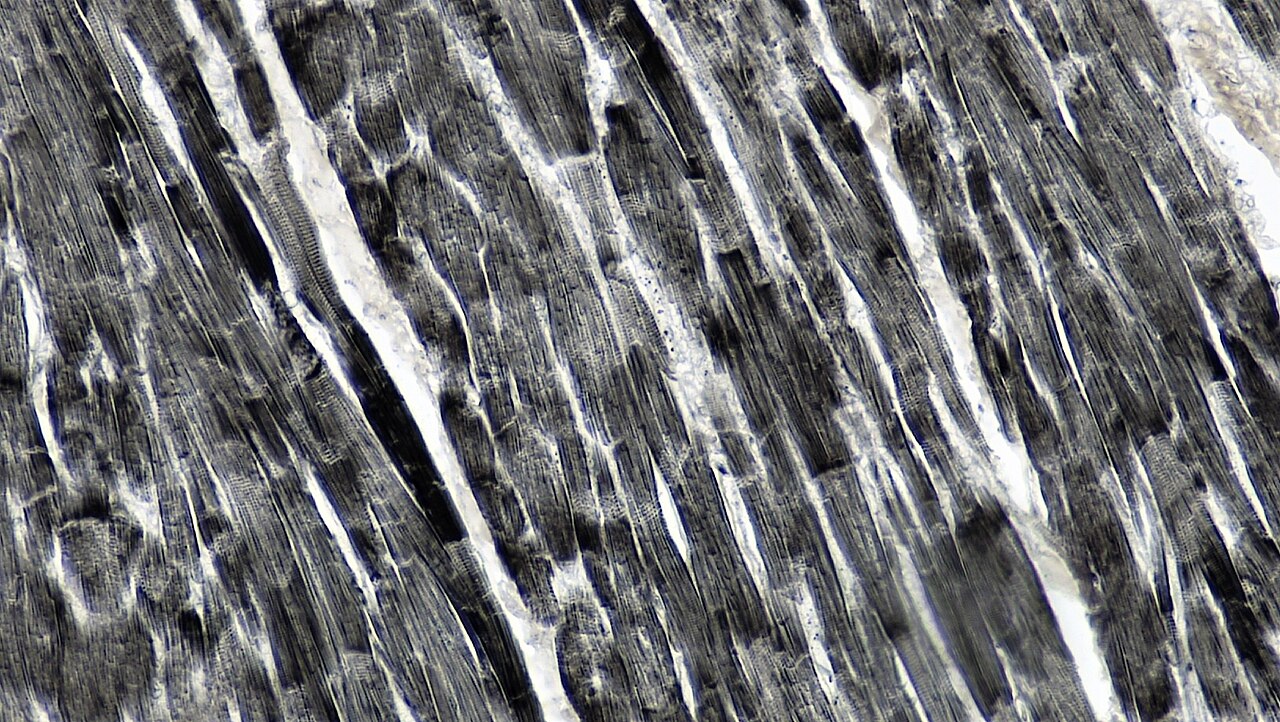
Source: Muscle Tissue: Intercalated Discs in Cardiac Muscle; original source record.
Creator: Berkshire Community College Bioscience Image Library. License: CC0-1.0. Open the full image.
Preparation: Source: long section of cardiac muscle; species and stain not reported.
Source magnification: 200× in the source description
Scale and measurement: 200× in the source description. No calibrated scale bar is supplied in this displayed image. The source magnification is historical acquisition metadata, not a calibration of screen or printed pixels; do not calculate cell size from it.
Image changes: Wikimedia 1280-pixel display derivative; no local cropping, color changes, labels, or generated replacement. The image is reduced for display, not newly measured.
Visible features to compare:
- Fine repeated striations cross the lengthwise muscle profiles.
- Darker transverse bands occur less regularly; the source identifies these as intercalated discs between cardiac cells.
Interpretation limits: Do not label every dark band as a disc: compare the finer repeated striations with broader junctional bands. Gap-junction channels and electrical conduction are not resolved. Contraction rate, rhythm, and cardiac output cannot be inferred from this preserved field.
Smooth muscle: spindle-shaped profiles without resolved striations
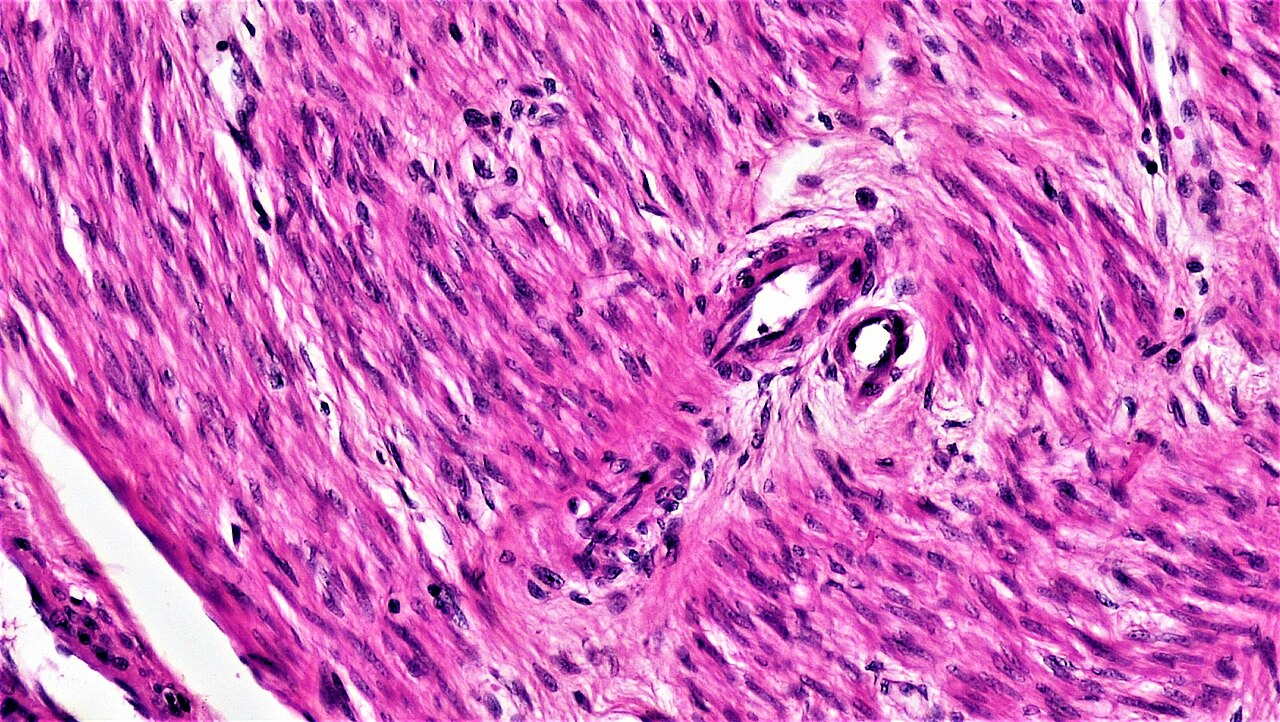
Source: Muscle Tissue: Smooth; original source record.
Creator: Berkshire Community College Bioscience Image Library. License: CC0-1.0. Open the full image.
Preparation: Source: smooth-muscle cross section; displayed bundles include lengthwise and oblique profiles. Organ, species, and stain not reported.
Source magnification: 200× in the source description
Scale and measurement: 200× in the source description. No calibrated scale bar is supplied in this displayed image. The source magnification is historical acquisition metadata, not a calibration of screen or printed pixels; do not calculate cell size from it.
Image changes: Wikimedia 1280-pixel display derivative; no local cropping, color changes, labels, or generated replacement. The image is reduced for display, not newly measured.
Visible features to compare:
- Many elongated nuclear profiles align within differently directed bundles.
- A regular skeletal-like striation pattern is not resolved in this field.
Interpretation limits: Absence of resolved striations alone does not prove smooth muscle; combine nuclear shape, bundle organization, and the source identity. A section through an organ can include vessels and connective tissue. Neither force nor involuntary control is directly visible.
Spinal-cord smear: neuron soma and processes
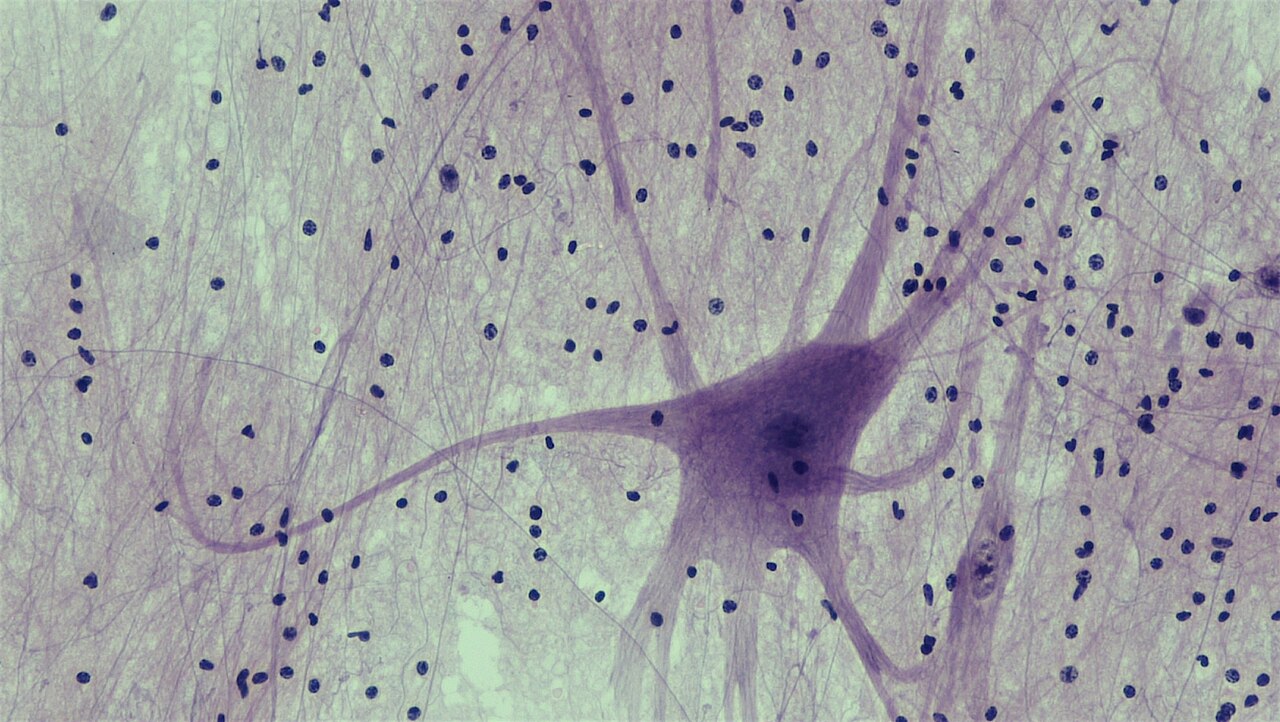
Source: Nervous Tissue: Spinal Cord Motor Neuron; original source record.
Creator: Berkshire Community College Bioscience Image Library. License: CC0-1.0. Open the full image.
Preparation: Source: spinal-cord smear; species and stain not reported. A smear does not preserve the full spinal-cord architecture.
Source magnification: 200× in the source description
Scale and measurement: 200× in the source description. No calibrated scale bar is supplied in this displayed image. The source magnification is historical acquisition metadata, not a calibration of screen or printed pixels; do not calculate cell size from it.
Image changes: Wikimedia 1280-pixel display derivative; no local cropping, color changes, labels, or generated replacement. The image is reduced for display, not newly measured.
Visible features to compare:
- A large cell body gives rise to several tapering processes, unlike a sheet of epithelial cells.
- Many smaller dark nuclear profiles occur around the larger soma; fine background processes overlap.
Interpretation limits: The source identifies a motor neuron, but the smear alone cannot prove its motor target, trace a whole axon, distinguish every glial subtype, or measure impulse velocity. Tissue preparation has disrupted the original three-dimensional circuitry.

.jpg)
.jpg)
.jpg)
.jpg)
.jpg)

.jpg)
.jpg)
.jpg)
Diagram description
Anatomical planes divide the body in defined directions. The cell membrane separates intracellular from extracellular fluid; plasma and interstitial fluid are extracellular compartments in different locations. The four primary tissue families are epithelial, connective, muscle, and nervous. Osmosis rows show direction from supplied bath conditions and compute final volume only from model inputs.
Data, provenance, and assumptions
| Image | Printed scale bar (mm) | Actual scale bar (micrometres) | Printed cell width (mm) |
|---|---|---|---|
| Image A | 48 | 120 | 8 |
| Bath | Initial cell volume (pL) | Initial cell osmolarity (mOsm/L) | Bath osmolarity (mOsm/L) |
|---|---|---|---|
| Equal | 1 | 300 | 300 |
| Dilute | 1 | 300 | 240 |
| Concentrated | 1 | 300 | 360 |
| Cube | Side length (micrometres) |
|---|---|
| Small | 10 |
| Large | 20 |
Worked model
The reference bar represents 120 micrometres but prints at 48 mm = 48,000 micrometres, so image magnification is 400 times. A cell spanning 8 mm represents (8/48) × 120 = 20 micrometres. In the dilute bath, conservation gives V_final = 300 × 1/240 = 1.25 pL, a 25% increase. The concentrated bath gives 0.833333 pL. For a cube, area/volume = 6L^2/L^3 = 6/L, so doubling side length halves this ratio.
Numerical calibration
- 400 times at this printed size
- 20 micrometres
- 1.25 pL
- 0.833333 pL
- 0.3 per micrometre
Attempt the assigned level
Try the tasks before reading the calibration. These are practice answers, not a secure examination; use a new dataset or changed assumption for the assessed transfer.
Foundation
- Annotate one assigned tissue figure with its source and two visible features. Match the four tissue families to their functions, and name a feature that is only present in the explanatory drawing.
- Use a supplied body outline to label subject-right, anterior, superior, one transverse plane, and the thoracic cavity.
- Predict whether water enters or leaves each ideal cell; calculate the cell width from the scale bar using equal fractions.
- Use the labeled atlas as an open reference. Choose one image from each tissue family, record two visible features per image, and identify one detail that the source names but the image alone cannot prove.
Check after your attempt
- A defensible epithelial identification cites a continuous cell sheet and little intervening matrix if both are visible. Channels in the membrane diagram are model labels, not light-microscope observations. Connective tissue supports/transports, muscle develops force, and nervous tissue processes signals.
- Right belongs to the subject, anterior faces the front, superior points toward the head, and a transverse plane separates upper from lower regions. The thoracic cavity contains the lungs and heart.
- No net volume change in the equal bath, water entry in the dilute bath, and water exit in the concentrated bath. Cell width is 20 micrometres.
- Examples: epithelial sheet or luminal ring; connective cells separated by matrix or fibrous bundles; muscle profiles with or without resolved striations; neuron soma with processes. Transporter identity, mechanical strength, contraction rate, and motor target all need additional evidence. This is reference interpretation, not an unseen identification score.
Core
- Compute magnification, all final cell volumes, and percentage volume changes. State the membrane assumption.
- Explain why simple squamous alveolar epithelium and a kidney tubule need different structures. Trace cell → tissue → organ → system for the kidney.
- Explain why two equally osmolar solutions need not have equal tonicity.
- Compare kidney tubules with thyroid follicles, then compare the three muscle fields. Use organization and visible evidence rather than color alone. Explain why the atlas acquisition magnification cannot calibrate your screen.
Check after your attempt
- Magnification: 400 times at this size. Final volumes: 1, 1.25, and 0.833333 pL; changes: 0%, +25%, and about −16.7%. The listed solute cannot penetrate, while water can.
- A thin alveolar barrier shortens diffusion distance; a polarized tubule epithelium supports selective transport. Tubule cell → epithelial tissue → kidney → urinary system. Both organs also contain other tissue families.
- A penetrating solute can cross and dissipate its osmotic effect. Equal total particle counts do not establish equal concentrations of nonpenetrating particles.
- Kidney lumens are mostly open in this field, whereas thyroid follicles contain source-identified colloid. Skeletal fibers are long and regularly striated; cardiac fields include larger junctional bands; smooth fields have elongated nuclei and no resolved regular striations. Section angle, stain, and source metadata limit each claim. Screen size and resizing change magnification; a calibrated scale bar is required for size measurement.
Honors extension: typically grades 11-12
- Compare the cubes’ surface-area-to-volume ratios with units. Explain why geometry alone does not determine transport rate.
- The image is resized to half its original printed dimensions. Predict the new magnification and the cell width inferred from the resized scale bar.
- State two failures of the ideal-cell equation and why a micrograph cannot independently establish channel permeability.
- Audit the skeletal-muscle orientation discrepancy and the teased-tendon/spinal-smear preparation limits. Propose one additional view or measurement that would test an uncertain inference without claiming you collected it.
Check after your attempt
- The ratios are 0.6 and 0.3 per micrometre. Permeability, diffusion distance, concentration gradients, and transport proteins also matter.
- Magnification becomes 200 times; the resized cell and bar retain their ratio, so inferred cell width remains 20 micrometres.
- Solute entry or active volume regulation violates constant intracellular nonpenetrating solute; tension or lysis violates the ideal-bag model. Transport experiments or other evidence are needed to establish permeability.
- The skeletal source says cross section although the displayed fibers run lengthwise. Teasing and smearing alter spatial relationships. A separately sourced perpendicular section, a verified scale bar, or an appropriate functional measurement could test a stated inference; this proposal is not an observed practical or a procedure authorization.
History, reading, and writing connection
Use the micrograph and schematic in OpenStax 4.2 to write a source-linked comparison of seeing and explaining. State the edition and figure identifier. Model response: the cell sheet and arrangement are visual evidence, whereas membrane transport is a mechanistic interpretation requiring additional experiments. A modern textbook synthesizes evidence; it is not the original notebook of an early microscopist. Explain how better instruments can revise a tissue account without treating every new drawing as a new observation.
Write in your own words or use an approved accessible equivalent. Cite a specific assigned section or figure, identify its evidence, and state one limitation or counterargument. Use the AI practice contract only for permitted coaching, never to invent observations or write the assessed response.
Transfer to a new case
A fresh ideal cell starts at 0.8 pL and 300 mOsm/L in a 400 mOsm/L nonpenetrating bath. What final volume follows, and would the same formula necessarily apply to a freely penetrating solute?
Calibration: 0.8 × 300/400 = 0.6 pL. No: a penetrating solute violates the fixed intracellular nonpenetrating-solute assumption, so its entry and the time course must be considered.
Evidence to retain
Keep the annotated source figure, scale conversion, compartment sketch, selected level, and one unresolved feature. An image-identification alternative demonstrates interpretation, not slide preparation or microscope handling.
Record units, calculations, source/date, uncertainty, and what is measured versus inferred. A simulation or supplied dataset must stay labeled as such. Educational fictional cases only: no diagnosis of the learner, real patient uploads, treatment or dosing prescriptions, invasive tests, medical procedure instructions, exercise challenges, breath-holding, or forced personal measurements. No personal, reproductive, or health disclosure is required. Use supplied data and models or an instructor-approved noninvasive demonstration with an agreed alternative. Textbook equations do not certify diagnostic or professional skill; this elective is not a licensed medical course, an AP course, or a claim of college credit.
Return to all eight learning pathways. Print this unit page for the student lessons; the linked five-page packet remains the separate assessment companion.
Unit mastery rubric
| Criterion | Developing | Proficient | Mastery |
|---|---|---|---|
| Cell structure & membrane transport | Confuses cell structures or the direction of osmotic water movement. | Names structures but needs help separating visible features from models or applying the membrane assumptions. | Connects cell structures to function, distinguishes observed from unresolved features, and explains the selected osmotic model with its nonpenetrating-solute assumption. |
| The four primary tissue types | Cannot distinguish the four tissue families or treats color alone as proof. | Names families and functions but needs help comparing source-image features. | Names the four tissue families and their functions; compares labeled reference images using cell organization and matrix. |
| Levels of organization & compartments | Cannot order the levels or separate intracellular from extracellular fluid. | Orders the levels but needs help placing an organ example and its fluid boundaries. | Orders cell, tissue, organ, system, and organism with examples; places plasma and interstitial fluid outside cells and explains that organs combine tissue types. |
| The body plan & directional terms | Cannot describe anatomical position or use directional terms. | Knows anatomical position but confuses paired directional terms or the body planes. | Places the body in anatomical position, uses directional terms and planes correctly, and locates the major cavities and regions. |
| Histology identification & scale | Cannot support an image interpretation or treats acquisition magnification as pixel calibration. | Names a tissue but needs help with visible features, preparation limits, or scale. | Uses two visible features and source/preparation limits; measures only with a calibrated bar. Labeled-image reasoning cannot certify unseen identification or unobserved microscope handling. |
| Integration (cross-domain) | Makes no supported connection between the source and the science. | Uses the source but needs help connecting evidence, writing, or limitations to the science. | Independently connects History, Reading, and Writing using a cited source, appropriate evidence, a limitation, and a scientific explanation. |
Integration is reported separately and cannot lower the science grade or block a science demonstration pass. Science and practical criteria determine that pass. Use the integration guide's evidence checklist for the separately reported criterion.
“In the assigned micrograph I can identify a closely packed cell sheet and little intervening matrix, supporting epithelium. I cannot resolve membrane channels. The 8 mm cell image is one sixth of the 48 mm bar representing 120 micrometres, so the cell is 20 micrometres wide.”
“It’s… cells? They’re pink. Maybe skin, I think — it’s the one with the layers.”
Defend the assigned tissue and scale evidence in the declared prepared-slide or source-image pathway. The image alternative assesses interpretation; microscope setup and focusing are credited only if separately assigned and observed. Explain the anatomy and model assumptions without claiming unresolved structures as observations.
A 5-page clipboard packet — unit overview, key terms, the mastery rubric, anchor examples, and a score sheet you can print and grade against.