Unit 06 · Marine Reptiles, Birds & Mammals
Sea turtles and sea snakes are reptiles, seabirds are birds, and whales, dolphins and seals are mammals. All are air-breathing tetrapods descended from terrestrial ancestors, although modern limbs are modified or reduced. Mammary glands and hair at some life stage are mammal traits; streamlined shape is convergent, not proof of fish ancestry.
Student learning: Interpret marine tetrapod adaptations without imitating them
Choose the level by readiness, not age alone, and record it before instruction. Foundation, core, and honors tasks are study pathways, not an AP course or a promise of college credit. The instructor retains practical assessment and the published science rubric; integration is reported separately.
Prerequisites: Gas exchange, cellular respiration, heat transfer, elapsed-time rates, and observational detection limits.
Suggested sequence: read and discuss the explanation; attempt the worked model; analyze the data at your selected level; check the answers; then complete the source-linked response and a fresh transfer question. These activities supplement, not replace, supervised practical work and the full-year schedule.
Assigned reading and focus
- OpenStax Biology 2e, 29.6: Mammals. Read Characteristics of Mammals, especially mammary glands, hair and metabolic heat. Use the diagnostic traits to distinguish a whale from a fish rather than relying on body shape alone.
- NOAA Fisheries: Humpback Whale. Read About the Species, Appearance, Behavior and Diet, and Population Status. Compare baleen feeding, migration and photo-identification with what a short encounter record can actually show. Professional field methods are context, not an activity.
Learn the science
Sea turtles and sea snakes are reptiles, seabirds are birds, and whales, dolphins and seals are mammals. All are air-breathing tetrapods descended from terrestrial ancestors, although modern limbs are modified or reduced. Mammary glands and hair at some life stage are mammal traits; streamlined shape is convergent, not proof of fish ancestry.
Mammals and birds generate substantial metabolic heat. Blubber or feather/air layers reduce heat transfer; insulation does not generate heat. Many marine reptiles depend more strongly on external heat, although large size and other adaptations modify heat balance. A single insulation model cannot represent the physiology of all tetrapods.
Marine mammals can have large blood/muscle oxygen stores, circulatory adjustments and pressure adaptations. Myoglobin stores oxygen in muscle; hemoglobin transports it in blood. These species-specific traits are studied through existing evidence, never through a human imitation. No diving, breath-holding, cold-exposure challenge or altered-breathing exercise is part of this unit.
Baleen whales filter prey; toothed cetaceans capture prey with teeth, and many use echolocation. Migration links feeding and breeding resources, not a universal rule that every whale follows the same route. NOAA’s humpback account illustrates both historical exploitation and differing population recoveries.
An encounter rate is observations per unit effort. Sea state, observer, field of view, behavior and repeat sightings affect detection. A short encounter series is not a population census. A tagged-depth series represents one recorded track, not a maximum possible dive or a safe human limit.

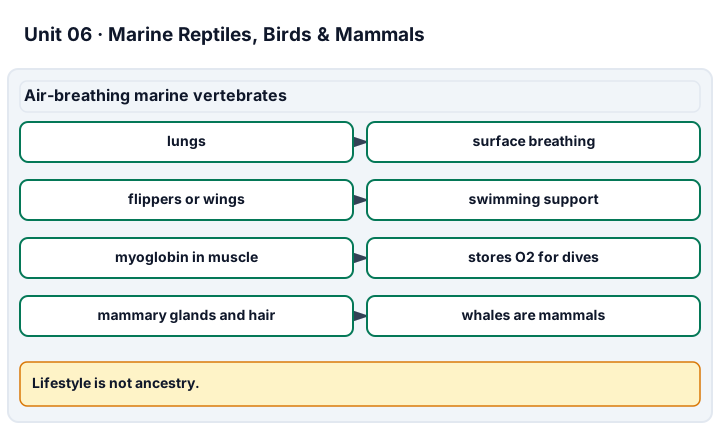
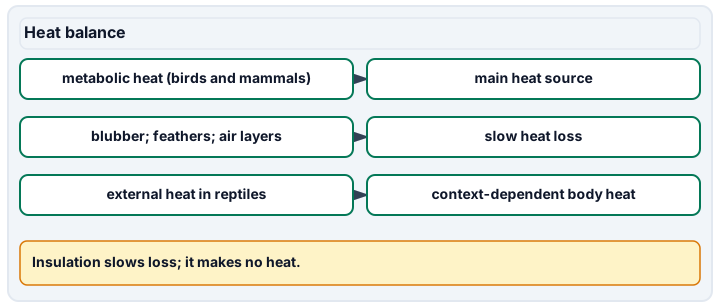
Diagram description
Marine reptiles, birds, and mammals all breathe air but belong to different branches. Lungs require surfacing, flippers or wings support swimming, myoglobin stores oxygen in muscle for dives, and mammary glands plus hair at some stage show whales are mammals. Insulation slows heat loss but does not create heat.
Data, provenance, and assumptions
| Time (min) | Bare-container temperature (degrees C) | Insulated-container temperature (degrees C) |
|---|---|---|
| 0 | 35 | 35 |
| 5 | 31 | 33 |
| 10 | 28 | 31 |
| Sea-state category | Observation effort (min) | Group encounters |
|---|---|---|
| Calm | 40 | 8 |
| Calm | 60 | 12 |
| Rough | 40 | 4 |
| Rough | 60 | 6 |
| Elapsed time (min) | Depth (m) |
|---|---|
| 0 | 0 |
| 5 | 100 |
| 10 | 300 |
| 15 | 100 |
| 20 | 0 |
Worked model
Mean cooling rates are (35−28)/10 = 0.7 and (35−31)/10 = 0.4 degrees C/min, a 42.857% reduction relative to the bare model. Calm encounters are 20/100×60 = 12 per hour and rough encounters 10/100×60 = 6 per hour. The track’s trapezoidal area is 2,500 m·min, giving 125 m mean depth over 20 minutes, not a safe limit or a fully resolved trajectory.
Numerical calibration
- 0.7 degrees C/min decrease
- 0.4 degrees C/min decrease
- 42.857143 % relative to bare model
- 12 group encounters/hour
- 6 group encounters/hour
- 125 m, linear-interpolation time mean
Attempt the assigned level
Try the tasks before reading the calibration. These are practice answers, not a secure examination; use a new dataset or changed assumption for the assessed transfer.
Foundation
- Use the readings to distinguish a whale, a seabird and a sea turtle, and name the organ each uses to breathe air.
- Plot the two cooling curves and depth record; calculate each cooling change and the largest recorded depth.
Check after your attempt
- Whales are mammals with milk and hair at some life stage; seabirds have feathers; sea turtles are reptiles with a shell. All use lungs, not fish gills.
- Bare and insulated containers cool by 7 and 4 degrees C. The largest sampled depth is 300 m; deeper movement between timestamps is unobserved.
High-school core: typically grades 9-10
- Calculate cooling rates, relative reduction and encounter rates per hour using pooled time.
- Explain why these records neither demonstrate a blubber effect in a live whale nor establish fewer animals during rough conditions.
Check after your attempt
- Rates are 0.7 and 0.4 degrees C/min; reduction is 42.857%. Encounter rates are 12 and 6 groups/hour.
- The insulation record is a constructed inert model with no circulation or metabolic heat. Rough water can reduce detection; group encounters may repeat the same animals.
Honors extension: typically grades 11-12
- Use assumed detection probabilities 0.8 and 0.4 to adjust the two encounter rates; identify the assumption that prevents treating this as a census.
- Use trapezoids to estimate mean depth, then explain why averaging the five sample depths gives a different answer.
Check after your attempt
- Both adjusted rates are 15 encounters/hour. Probabilities are assumed, groups can repeat, and no closed population or individual identities are known; the result is a sensitivity exercise.
- Mean depth is 125 m; the unweighted five-point mean is 100 m. Endpoints represent half-interval weights in the time integral, and unobserved within-interval behavior remains uncertain.
History, reading, and writing connection
Read NOAA’s Population Status and Appearance sections and write a short conservation-history caption that distinguishes broad humpback recovery from identical recovery of every population. A supported response cites the population distinctions, explains why photo-identification improves on encounter totals, and names one present-day threat without publishing locations or tracking individuals.
Write in your own words or use an approved accessible equivalent. Cite a specific assigned section or figure, identify its evidence, and state one limitation or counterargument. Use the AI practice contract only for permitted coaching, never to invent observations or write the assessed response.
Transfer to a new case
Two observers each report 12 encounters, one in 30 minutes and one in 90 minutes. Are their rates equal, and does either count prove population size?
Calibration: No: 24 versus 8 encounters/hour. Neither establishes population size without comparable sampling, identities, coverage and detection.
Evidence to retain
Keep trait comparisons, cooling and depth graphs, rate denominators, detection sensitivity and the cited conservation caption. Inland supplied records do not count as performed physiology, field observation or animal-handling credentials; do not publish personal or sensitive animal locations.
Record units, calculations, source/date, uncertainty, and what is measured versus inferred. A simulation or supplied dataset must stay labeled as such. The inland supplied-data pathway is available in every unit with equivalent analysis evidence, not a performed field/practical credential. Optional observations require instructor and site approval from a dry, accessible location. No diving, breath-holding, marine-mammal physiology imitation, boats, wading, hazardous tidal sites, handling wild animals, unapproved collection, ingestion, unknown-microbe culture, or hatchery experiments.
Return to all eight learning pathways. Print this unit page for the student lessons; the linked five-page packet remains the separate assessment companion.
Unit mastery rubric
| Criterion | Developing | Proficient | Mastery |
|---|---|---|---|
| Air-breathing marine tetrapods | Groups all large marine animals as fish. | Names groups but not their shared ancestry. | Distinguishes marine reptiles, birds and mammals by traits; explains lungs and terrestrial ancestry. |
| Mammals, not fish | Uses shape alone for classification. | Calls whales mammals without diagnostic evidence. | Uses mammary glands, hair and other mammal traits; contrasts lungs with fish gills without ignoring convergence. |
| Diving adaptations (evidence only) | Treats animal data as a human challenge. | Names an adaptation without mechanism or limits. | Explains oxygen stores, circulatory and pressure adaptations from sources; interprets supplied tracks without human imitation. |
| Thermoregulation, feeding & migration | Treats insulation as heat generation. | Names blubber or feeding modes without context. | Explains metabolic heat and insulation, baleen/toothed feeding and migration; calculates model cooling rates with limits. |
| Lab technique (adaptation-data analysis) | Omits time, units or provenance. | Plots records but overclaims population or physiology. | Analyzes supplied cooling, depth and effort records; states detection/interpolation limits and separates analysis from observed practical work. |
| Integration (cross-domain) | Makes no supported connection between the source and the science. | Uses the source but needs help connecting evidence, writing, or limitations to the science. | Independently connects History, Reading, and Writing using a cited source, appropriate evidence, a limitation, and a scientific explanation. |
Integration is reported separately and cannot lower the science grade or block a science demonstration pass. Science and practical criteria determine that pass. Use the integration guide's evidence checklist for the separately reported criterion.
The inert models cool at 0.7 and 0.4 degrees C/min; that is not a live-whale experiment. Rough-condition encounters halve, but detection could also halve. The supplied track averages 125 m under linear interpolation, not a safe human depth.
No breath-holding, diving, cold-exposure or marine-mammal imitation is authorized. Interpretation of animal records must never become a physiological challenge.
Keep trait comparisons, cooling and depth graphs, rate denominators, detection sensitivity and the cited conservation caption. Inland supplied records do not count as performed physiology, field observation or animal-handling credentials; do not publish personal or sensitive animal locations. Integration is reported separately and cannot lower the science grade or block a science demonstration pass. Science and practical criteria determine that pass.
A 5-page clipboard packet — unit overview, key terms, the mastery rubric, anchor examples, and a score sheet you can print and grade against.