Unit 05 · Fish & Amphibians
Compare fish and amphibian structures, life stages and gas-exchange routes without treating living groups as evolutionary rungs. Not every bony fish has a swim bladder or every amphibian the same life cycle. Normalize supplied oxygen records by time and mass, retain body and medium temperatures, and distinguish a functional explanation from evidence of adaptation history.
Student learning: Fish & Amphibians: oxygen uptake in context
Choose the level by readiness, not age alone, and record it before instruction. Foundation, core, and honors tasks are study pathways, not an AP course or a promise of college credit. The instructor retains practical assessment and the published science rubric; integration is reported separately.
Prerequisites: Unit 01 selection check: independently explain inherited variation, differential reproduction and populations across generations before making an evolutionary adaptation claim. Convert minutes to hours and divide by mass; Unit 02 exchange-distance model supports the explanation.
Suggested sequence: read and discuss the explanation; attempt the worked model; analyze the data at your selected level; check the answers; then complete the source-linked response and a fresh transfer question. These activities supplement, not replace, supervised practical work and the full-year schedule.
Assigned reading and focus
- OpenStax Biology 2e, 39.1 Systems of Gas Exchange. Read "Direct Diffusion", "Skin and Gills" and "Tracheal Systems", including Figures 39.3-39.6. Identify exchange surfaces and diffusion distances; a respiratory structure can occur in several animal groups.
- OpenStax Biology 2e, 33.3 Homeostasis. Read "Endotherms and Ectotherms" and "Heat Conservation and Dissipation". Distinguish heat source from temperature constancy; compare insulation, metabolic heat and behavioral heat exchange as trade-offs.
Learn the science
Fish gills and amphibian skin or lungs exchange gases across thin moist surfaces; circulation can transport the gases onward. The exchange route is not the same as the oxygen demand. Some bony fishes lack a swim bladder, sharks use several buoyancy and ventilation strategies, and amphibian life histories vary. A fish is not a universal starting rung on a ladder ending with mammals.
Compare whole-organism oxygen uptake only after naming time, mass, temperature and activity. Rate = oxygen amount / hours; mass-specific rate = oxygen amount / hours / kg. The supplied fish is in freshwater and frog in humid air; the numbers have already been expressed as mg O2 for the whole organism. Equal numerical rates do not mean identical physiology, and different media prevent a fully controlled cross-species inference.
These are synthetic resting, postabsorptive adult records. At the baseline, water/air and body temperatures are assumed 20 deg C. F1 at 30 deg C is a second record of the same virtual fish, not an independent animal; it is not an instruction to heat a real animal. The frog route partition is another model assumption: it includes only skin and lungs and is not a procedure for separating real uptake routes.

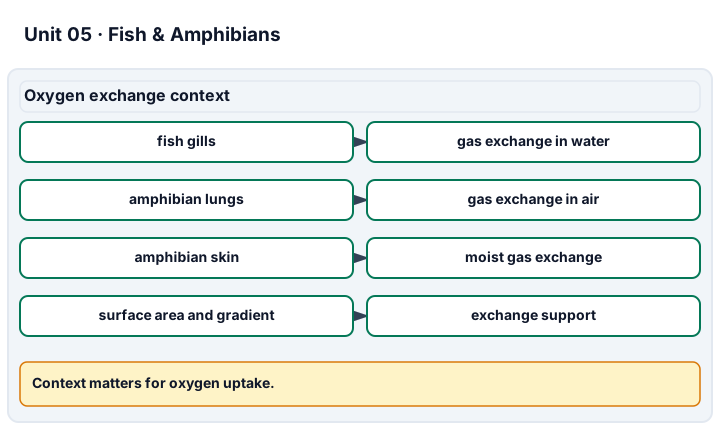
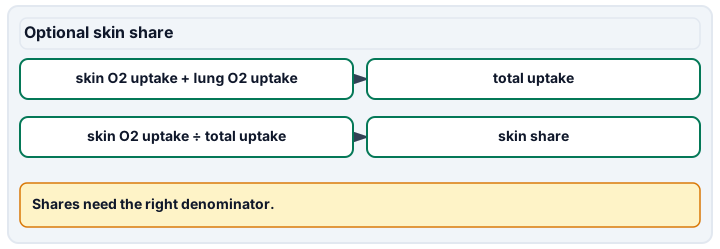
Diagram description
Fish gills exchange gases in water. Amphibian lungs exchange gases in air, and amphibian skin can exchange gases when moist. Mass-specific uptake must divide oxygen amount by time and mass, with minutes converted to hours. Skin share uses skin uptake divided by skin plus lung uptake.
Data, provenance, and assumptions
| Record | Mass (kg) | Duration (min) | Oxygen uptake (mg O2) | Body and medium temperature | Medium |
|---|---|---|---|---|---|
| F1 fish baseline | 0.1 | 30 | 12 | 20 deg C | Freshwater |
| F2 frog baseline | 0.025 | 15 | 1.5 | 20 deg C | Humid air |
| F1 fish warmer record | 0.1 | 30 | 24 | 30 deg C | Freshwater |
| F3 frog transfer | 0.05 | 20 | 4 | 20 deg C | Humid air |
| Modeled route | Oxygen uptake (mg O2) |
|---|---|
| Skin | 0.6 |
| Lungs | 0.9 |
Worked model
Fish F1: 12 mg / 0.5 h = 24 mg O2/h; 24/0.1 = 240 mg O2/(kg h). Frog F2: 1.5 mg / 0.25 h = 6 mg/h; 6/0.025 = 240 mg O2/(kg h). The fish total per hour is four times larger but the mass-specific rates match. The modeled frog skin share is 0.6/(0.6 + 0.9) = 40%, not 0.6/0.9. At 30 deg C the fish rate is 480 mg O2/(kg h), twice its 20 deg C rate; this single model contrast is not a universal temperature law.
Numerical calibration
- 240 mg O2/(kg h), F1 at 20 deg C
- 240 mg O2/(kg h), F2
- 40 % of modeled F2 uptake through skin
- 2 F1 rate ratio, 30/20 deg C
- 240 mg O2/(kg h), F3
Attempt the assigned level
Try the tasks before reading the calibration. These are practice answers, not a secure examination; use a new dataset or changed assumption for the assessed transfer.
Foundation
- Convert 30 and 15 minutes to hours and calculate F1/F2 whole-body mg O2/h.
- Use the route table to draw a 100% bar divided between skin and lungs.
Check after your attempt
- 30 min = 0.5 h; 15 min = 0.25 h. F1 = 24 mg/h, F2 = 6 mg/h.
- The total is 1.5 mg; skin is 40% and lungs 60% of that total in this two-route model.
High-school core: typically grades 9-10
- Calculate F1 and F2 mg O2/(kg h), keeping the mass and time denominators visible.
- Explain how moist exchange surfaces work and why matched rates alone do not show identical structures or evolutionary histories.
Check after your attempt
- Both are 240 mg O2/(kg h); whole-body totals differ because mass differs.
- Diffusion occurs across thin moist surfaces. Gills in water and skin/lungs in humid air have different context; rates alone do not identify route, inheritance or selection history.
Honors extension: typically grades 11-12
- Calculate the 30/20 deg C rate ratio and the illustrative Q10 = (R2/R1)^(10/(T2 - T1)).
- State why the model cannot predict rates at 40 deg C or isolate a genetic cause.
Check after your attempt
- R2/R1 = 480/240 = 2; with a 10 deg C interval, illustrative Q10 = 2.
- Thermal limits, acclimation and activity may change; two records of one virtual fish are not independent replication. Nothing here measures inheritance.
History, reading, and writing connection
Use an assigned gas-exchange figure as evidence in a short cited explanation of water/air constraints. Contrast the modern mechanism with a claim that an animal grew a needed organ to leave water. Identify what the figure and synthetic uptake table cannot establish about historical transitions.
Write in your own words or use an approved accessible equivalent. Cite a specific assigned section or figure, identify its evidence, and state one limitation or counterargument. Use the AI practice contract only for permitted coaching, never to invent observations or write the assessed response.
Transfer to a new case
For new frog F3, calculate whole-body and mass-specific oxygen uptake. Compare with F2 and explain why an equal mass-specific result cannot prove the same skin share. The instructor may change mass and duration on the fresh assessment record.
Calibration: 4 mg in 20 minutes is 12 mg O2/h. Dividing by 0.05 kg gives 240 mg O2/(kg h). This matches F2 per kg but is twice its whole-body rate. No route measurements are supplied for F3, so transferring F2's 40% skin share would be an unsupported inference.
Evidence to retain
For Gills, fins & oxygen comparison, retain independent calculations with mg O2/(kg h), body/medium temperatures, the route denominator, source annotations and a fresh mass/time transfer. Label independent analysis of supplied records separately from independent observation of approved media or safe non-intervention observation. Record the source/date, selected level, calculations, limitation and fresh follow-up; never relabel a supplied dataset as a performed lab.
Record units, calculations, source/date, uncertainty, and what is measured versus inferred. A simulation or supplied dataset must stay labeled as such. Use approved images/models, published or synthetic datasets, or instructor-approved non-intervention observation from safe access. No capture, animal manipulation, stress induction, feeding trials, biological sampling, or wildlife handling. Do not disturb nesting or rare animals or disclose sensitive wildlife sites. Stop if safe access or a non-disturbing view is unavailable; use supplied evidence instead. Instructor approval or a proposed observation is not a performed lab claim.
Return to all eight learning pathways. Print this unit page for the student lessons; the linked five-page packet remains the separate assessment companion.
Unit mastery rubric
| Criterion | Developing | Proficient | Mastery |
|---|---|---|---|
| Jawless, cartilaginous & bony fish | Treats all fish as one kind of animal. | Names the groups but places examples in the wrong one. | Sorts a lamprey, a shark, and a perch by jaw and skeleton and gives a defining trait for each grade. |
| Gills, fins & oxygen comparison | Confuses structures or compares uptake totals without denominators. | Explains exchange but needs help normalizing time, mass or route shares. | Explains exchange surfaces; independently calculates mg O2/(kg h) and route percentages, states body/medium temperatures and limits a fresh comparison. |
| The move onto land | Explains new structures by an individual's need. | Names a functional constraint but treats function as evolutionary evidence. | Connects support, water balance and gas exchange to terrestrial conditions while distinguishing present function from inherited population change. |
| Amphibian dual life & metamorphosis | Assumes all amphibians share one fishlike life cycle. | Describes a typical frog cycle but overlooks variation or skin exchange. | Explains a sourced amphibian life cycle and moist-skin exchange; recognizes that life stages and exchange routes vary among amphibians. |
| Lab technique (image & record analysis) | Invents observed structures or a performed procedure. | Uses a source figure but omits evidence mode or measurement context. | Independently annotates an approved image/model, distinguishes supplied records from observations and defends a new mass/time calculation without an animal procedure. |
| Integration (cross-domain) | Makes no supported connection between the source and the science. | Uses the source but needs help connecting evidence, writing, or limitations to the science. | Independently connects History, Reading, and Writing using a cited source, appropriate evidence, a limitation, and a scientific explanation. |
Integration is reported separately and cannot lower the science grade or block a science demonstration pass. Science and practical criteria determine that pass. Use the integration guide's evidence checklist for the separately reported criterion.
“F1 uses 24 mg O2/h and F2 uses 6, but both are 240 mg O2/(kg h). Their mass and medium differ. The modeled frog skin share is 0.6/1.5 = 40%; I cannot assign that share to a new frog without route evidence. These are supplied numbers, not my measurements.”
“Fish are all pretty much the same. A frog is basically a lizard. Gills are for swimming, right?”
Use approved anatomical images/models and supplied oxygen records. No capture, dissection, heating, drying, gas-exchange trial or biological sampling is assigned. The instructor checks the student's calculations, evidence mode and fresh comparison, not a claim that a supplied model was a performed lab.
A 5-page clipboard packet — unit overview, key terms, the mastery rubric, anchor examples, and a score sheet you can print and grade against.