Unit 05 · The Atmosphere & Weather
This unit builds the sky from the ground up: the layered structure of the atmosphere, the air masses that carry their source regions with them, the fronts where those air masses collide, and the pressure, temperature, and humidity that together decide what the day will do. Mastery means you can read a weather map as moving air masses and fronts — and hold the difference between today's weather and the climate that sets its bounds.
Student learning: Calculate pressure gradients, relative humidity and dew-point limits
Choose the level by readiness, not age alone, and record it before instruction. Foundation, core, and honors tasks are study pathways, not an AP course or a promise of college credit. The instructor retains practical assessment and the published science rubric; integration is reported separately.
Prerequisites: Foundation: signed differences, percentages and table lookup. Core: rates per distance and ratios. Honors: endpoint propagation and comparisons with unequal denominators. Readiness check: 6 hPa over 300 km is 2 hPa per 100 km. Do not enter a logarithm or assume a weather rule when a supplied ratio/table answers the question.
Suggested sequence: read and discuss the explanation; attempt the worked model; analyze the data at your selected level; check the answers; then complete the source-linked response and a fresh transfer question. These activities supplement, not replace, supervised practical work and the full-year schedule.
Assigned reading and focus
- NOAA/NWS Louisville: Water Vapor, Humidity and Dewpoint. Read Relative Humidity and Dewpoint. Explain why relative humidity depends on both moisture and temperature and why saturation alone does not establish precipitation.
- OpenStax College Physics 2e, 13.6: Humidity, Evaporation, and Boiling. Read the partial-pressure definition and the 15, 20 and 30 C rows of Table 13.5 only. Use the converted tabulated pressures below for calculation; do not carry out heating or boiling experiments.
Learn the science
A signed spatial pressure gradient divides a pressure difference by horizontal distance at the same time. A temporal pressure change at one station is a different quantity. Neither alone specifies wind speed, a front's position or future storms.
Relative humidity RH = 100 e/es(T), where e is actual water-vapour partial pressure and es(T) is saturation vapour pressure at air temperature T. Both pressures must use the same units. They are not the total atmospheric pressure in the station table.
At fixed e and total pressure, warming lowers RH because es(T) increases. Dew point is the temperature at which es equals e; the reference table supports lookup at the provided values, not unjustified precision between them.
The fictional station temperatures and pressures are a spatial snapshot, not evidence of a moving storm or a regional climate trend. Meteorologists use spatial and time-series observations, physical models and uncertainty; this worksheet is not a forecast.

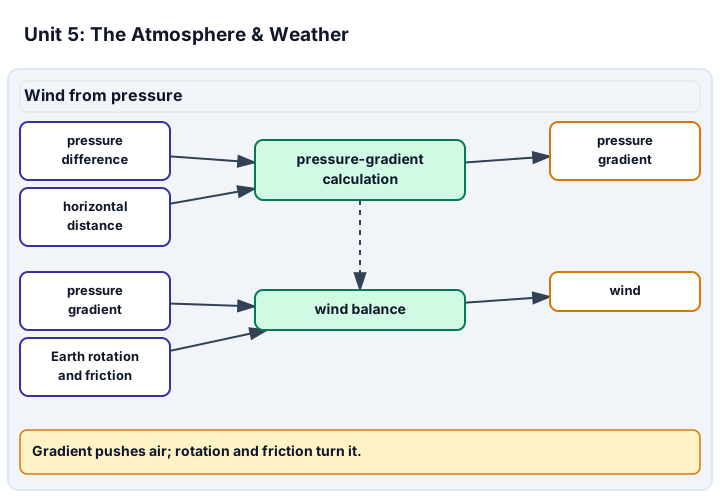
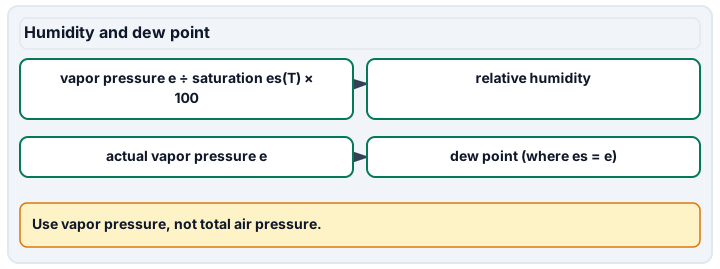
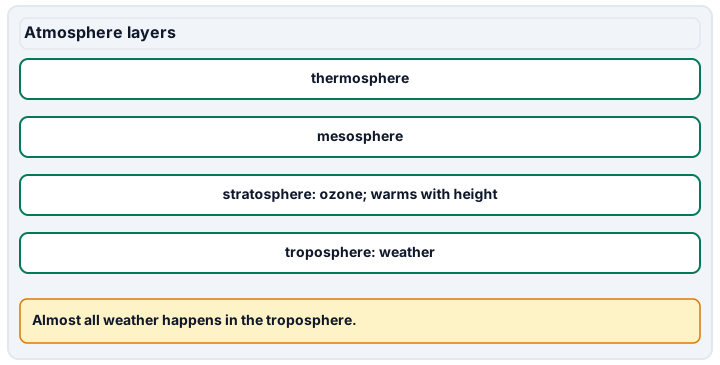
Diagram description
A pressure difference over horizontal distance gives the pressure gradient, which pushes air, while Earth's rotation and friction turn the wind. Relative humidity is vapor pressure divided by saturation vapor pressure at the air temperature, and the dew point is where saturation vapor pressure equals the actual vapor pressure. The atmosphere panel lists the thermosphere, mesosphere, the ozone-bearing stratosphere that warms with height, and the troposphere where almost all weather happens, top to bottom, with no arrows.
Data, provenance, and assumptions
| Point | Eastward distance (km) | Pressure (hPa) | Temperature (C) |
|---|---|---|---|
| West | 0 | 1014 | 20 |
| East | 300 | 1008 | 14 |
| Temperature (C) | Saturation vapour pressure (kPa) |
|---|---|
| 15 | 1.69 |
| 20 | 2.33 |
| 30 | 4.24 |
| Actual vapour pressure e (kPa) | Assumed e bound (+/- kPa) |
|---|---|
| 1.69 | 0.05 |
Worked model
Eastward pressure gradient = (1008 - 1014)/300 x 100 = -2 hPa per 100 km. The temperature gradient is also numerically -2, but in C per 100 km, not pressure units. At 20 C the independent parcel has RH = 100 x 1.69/2.33 = about 72.5%. Its dew point is 15 C in the supplied table, where es = 1.69 kPa.
Numerical calibration
- -2 hPa per 100 km eastward
- -2 C per 100 km eastward
- 72.5322 % RH at 20 C, use about 72.5% in interpretation
- 39.8585 % RH at 30 C
- 15 C, coarse-table dew point
- 69.1983 % RH, assumed endpoint lower bound
- 75.9825 % RH, assumed endpoint upper bound
Attempt the assigned level
Try the tasks before reading the calibration. These are practice answers, not a secure examination; use a new dataset or changed assumption for the assessed transfer.
Foundation: typically grades 7-8
- Calculate signed eastward pressure and temperature differences, then express each per 100 km. Identify the variables and units on a labeled transect.
- Use the saturation table to find the parcel's dew point and calculate RH at 20 C.
Check after your attempt
- Pressure falls 6 hPa and temperature falls 6 C over 300 km: -2 hPa per 100 km and -2 C per 100 km. Equal numerical differences do not make pressure and temperature the same variable.
- Dew point is 15 C in this coarse reference table; RH at 20 C is about 72.5%. Dew point alone does not specify RH without air temperature.
High-school core: typically grades 9-10
- Calculate RH at 30 C at the same e. Compare with 20 C and explain whether the parcel gained water vapour.
- Use the +/-1 hPa bounds at both stations to calculate the minimum and maximum signed pressure gradient. Explain why this is not a prediction of a particular front.
Check after your attempt
- RH = 100 x 1.69/4.24 = about 39.9%. The actual partial pressure is unchanged; the saturation reference rose, so RH fell.
- Differences range from 1007 - 1015 = -8 to 1009 - 1013 = -4 hPa; gradients span -2.667 to -1.333 hPa per 100 km. A two-point snapshot does not identify a front or its motion.
Honors extension: typically grades 11-12
- At 20 C, propagate e = 1.69 +/-0.05 kPa and es = 2.33 +/-0.04 kPa to RH bounds using endpoint combinations. State what uncertainty this does not cover.
- A second fictional transect drops 4 hPa over 100 km. Compare its gradient magnitude with the first, then explain why neither gives wind speed or permission to approach a storm.
Check after your attempt
- Minimum = 100 x 1.64/2.37 = 69.198%; maximum = 100 x 1.74/2.29 = 75.983%. These sensitivity bounds omit other instrument, height, time and model errors and are not a statistical confidence interval.
- The second magnitude is 4 hPa per 100 km, twice the first's nominal 2 despite a smaller raw pressure drop. Rotation, friction, evolving structure and more observations matter; these values cannot support a location or safety forecast.
History, reading, and writing connection
Compare NWS's explanation of dew point with the OpenStax partial-pressure definition. Write a source-cited correction to a fictional bulletin that equates falling pressure with a certain storm and high RH with a large amount of water vapour. Explain what observations are missing rather than issuing a forecast.
Write in your own words or use an approved accessible equivalent. Cite a specific assigned section or figure, identify its evidence, and state one limitation or counterargument. Use the AI practice contract only for permitted coaching, never to invent observations or write the assessed response.
Transfer to a new case
A fresh fictional parcel has e = 1.165 kPa at 20 C. Foundation: calculate RH. Core: express a separate 6 hPa fall over 6 hours as a temporal rate, not a spatial gradient. Honors: compare a 6 hPa fall over 100 km with the original 300 km transect. All levels: explain why the table cannot give this new parcel's exact dew point.
Calibration: Foundation: RH = 100 x 1.165/2.33 = 50%. Core: the temporal rate is -1 hPa/hour, not hPa per 100 km. Honors: the new spatial gradient is -6 hPa per 100 km, three times the original magnitude. The new e is below the lowest tabulated saturation pressure, so an exact dew point is not supplied.
Evidence to retain
Retain the agreed level's transect, humidity/table work or bounds, and the new-parcel transfer with units and a forecast limitation. These count in the Pressure and humidity quantities and Weather-data reasoning science criteria, not integration credit. Supplied records do not prove instrument operation or safe field practice. Sources checked 2026-09-27.
Record units, calculations, source/date, uncertainty, and what is measured versus inferred. A simulation or supplied dataset must stay labeled as such. No field exposure or weather chasing; no water sampling, ingestion, or chemical tests; no solar viewing. Use supplied data and approved images or non-destructive indoor alternatives only. A worksheet does not demonstrate practical performance or authorize a real location or safety forecast.
Return to all eight learning pathways. Print this unit page for the student lessons; the linked five-page packet remains the separate assessment companion.
Unit mastery rubric
| Criterion | Developing | Proficient | Mastery |
|---|---|---|---|
| Atmospheric structure | Cannot name the layers or thinks the air is uniform top to bottom. | Names the troposphere and above but cannot say what changes with height. | Describes how temperature, pressure, and composition change through the layers and where weather happens. |
| Air masses & fronts | Treats one pressure change as a certain storm. | Describes front types but overstates a two-point record. | Explains typical frontal changes and identifies missing observations rather than issuing a real forecast. |
| Pressure and humidity quantities | Confuses total pressure, vapour pressure or units. | Calculates ratios or gradients with help but omits assumptions. | At the agreed level, calculates signed gradients, RH/dew point or bounds from the supplied tables and defends their limits. |
| Weather vs. climate | Thinks weather and climate are the same thing. | States the difference but applies it inconsistently. | Distinguishes a weather event from a climate pattern and explains what each time-scale can and cannot tell you. |
| Weather-data reasoning | Invents readings or confuses spatial and temporal change. | Labels the record but needs help with a changed parcel or interval. | At the agreed level, defends the new-parcel transfer, record type and uncertainty without claiming instrument or forecasting competence. |
| Integration (cross-domain) | Makes no supported connection between the source and the science. | Uses the source but needs help connecting evidence, writing, or limitations to the science. | Independently connects History, Reading, and Writing using a cited source, appropriate evidence, a limitation, and a scientific explanation. |
Integration is reported separately and cannot lower the science grade or block a science demonstration pass. Science and practical criteria determine that pass. Use the integration guide's evidence checklist for the separately reported criterion.
“The fictional eastward pressure gradient is -2 hPa per 100 km. The independent parcel has about 72.5% RH at 20 C and 39.9% at 30 C with the same vapour pressure. The two-station snapshot neither locates a front nor tells us what weather will happen next.”
“Weather and climate are the same thing. High pressure means it’s hot. I just wrote down the numbers.”
Use the supplied fictional transect and parcel tables. At the agreed level, retain calculations, units, uncertainty and new-case transfer, then defend the interpretation. No weather chasing, field exposure or real location/safety forecast is assigned. A worksheet does not demonstrate instrument operation; integration is separately reported.
A 5-page clipboard packet — unit overview, key terms, the mastery rubric, anchor examples, and a score sheet you can print and grade against.