Unit 07 · The Hydrosphere (oceans & the water cycle)
Almost all of Earth's water is in one connected system, and this unit follows it. It covers the water cycle in full — evaporation and transpiration, condensation and precipitation, runoff and the groundwater most people forget — and then the ocean that drives it: the currents that move heat around the planet, the waves and tides that shape the coast, and the salinity that sets seawater apart from fresh. Mastery means you can trace a water molecule through every reservoir, not just from the puddle to the cloud and back.
Student learning: Distinguish freshwater storage, discharge, salt balance and heat transport
Choose the level by readiness, not age alone, and record it before instruction. Foundation, core, and honors tasks are study pathways, not an AP course or a promise of college credit. The instructor retains practical assessment and the published science rubric; integration is reported separately.
Prerequisites: Foundation: proportions and g/kg concentration. Core: area x velocity, summing unequal sections and mass-weighted means. Honors: products, MW conversion and bounded sensitivity. Readiness check: 2 m x 0.5 m x 0.3 m/s = 0.3 m^3/s; 35 g/kg in 1000 kg solution is 35 kg of salt. Work through these units before the higher lane.
Suggested sequence: read and discuss the explanation; attempt the worked model; analyze the data at your selected level; check the answers; then complete the source-linked response and a fresh transfer question. These activities supplement, not replace, supervised practical work and the full-year schedule.
Assigned reading and focus
- USGS Water Science School: Where Is Earth's Water?. Read One estimate of global water distribution, including the separate fresh and saline groundwater rows. The table cites Igor Shiklomanov in Gleick, Water in Crisis (1993). These are reference estimates, not a live inventory or accessible drinking-water supply.
- USGS Water Science School: How Streamflow Is Measured. Read The discharge measurement and its subsection method. USGS professional fieldwork is background, not a student procedure; calculate from the supplied cross-section instead.
Learn the science
Most total fresh water is stored in ice caps and glaciers. Most liquid fresh water is groundwater. Neither statement says that all groundwater is fresh, accessible, renewable at demand rates or safe to drink. Keep frozen and liquid reservoirs and saline versus fresh categories separate.
The reference storage table gives volumes present, not flow rates. Summing the selected freshwater categories gives an approximate inventory; rounding and historical estimation limit precision. Ground ice and permafrost are frozen storage, not liquid groundwater. Atmospheric water is a different, mixed-state category.
Discharge Q = sum(width x mean depth x subsection mean velocity). Area-weighted subsection velocities are not interchangeable with one surface speed or an unweighted average. Stage is water height relative to a datum, not discharge unless a suitable rating relation is available.
Here salinity is explicitly grams of dissolved salt per kg of solution, not practical salinity units. Mixed concentration = total salt mass/total solution mass under the assumption of no salt or water exchange. Use solution mass, not solvent mass or an unweighted mean of concentrations.
For the separate idealized ocean-current model, heat transport relative to a specified reference temperature is density x Q x heat capacity x temperature difference. The units reduce to J/s = W; divide by one million for MW. Density and heat capacity are supplied approximations, not inferred from salinity alone.
An advected heat flux relative to a reference is not automatically heat delivered to the atmosphere, regional warming or a climate forecast. A complete heat budget also needs return flows, mixing, losses, storage and boundary conditions.

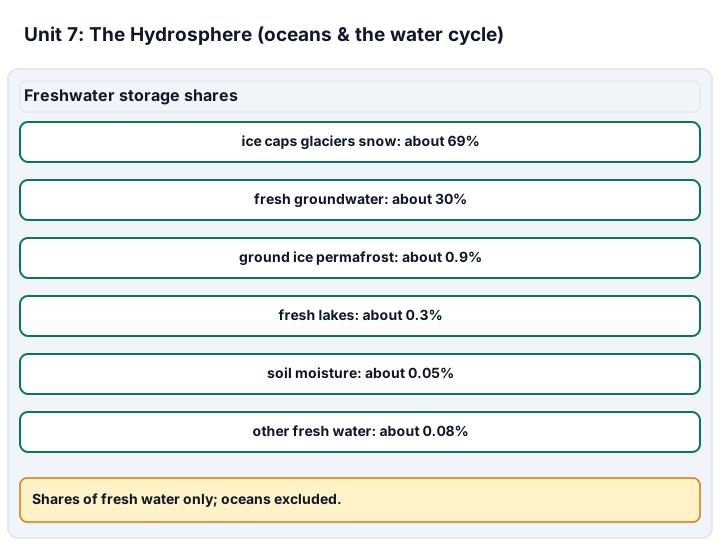
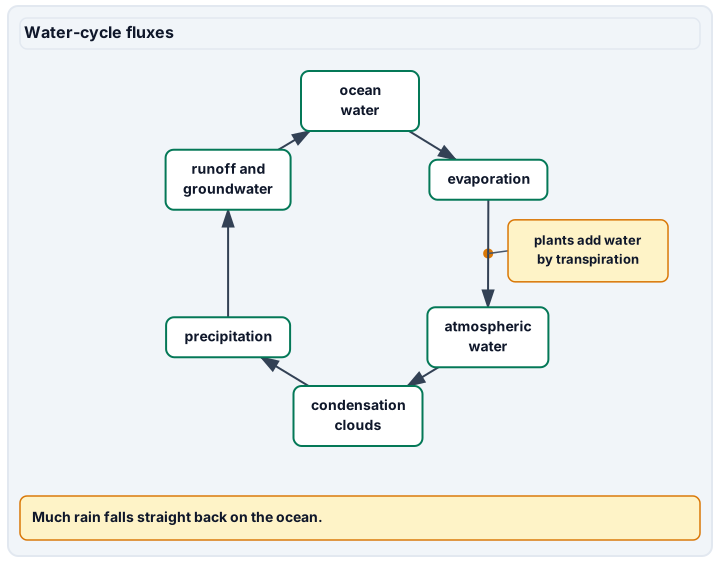
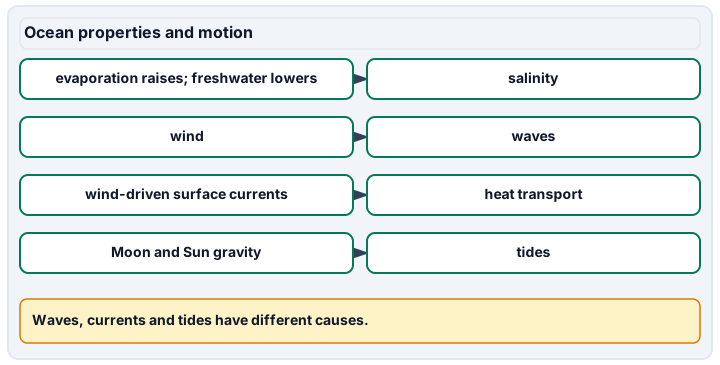
Diagram description
The freshwater-share grid lists approximate freshwater shares from fresh categories, excluding oceans. The water cycle runs from ocean water through evaporation, atmospheric water, condensation clouds and precipitation to runoff and groundwater that return to the ocean, with a marker for plant transpiration and a caption noting rain that falls straight on the ocean. The ocean panel pairs each effect with its cause: evaporation raises and freshwater input lowers salinity; wind makes waves; wind-driven surface currents carry heat; Moon and Sun gravity cause tides.
Data, provenance, and assumptions
| Freshwater category | Estimated volume (km^3) |
|---|---|
| Ice caps, glaciers and permanent snow | 24064000 |
| Fresh groundwater | 10530000 |
| Soil moisture | 16500 |
| Ground ice and permafrost | 300000 |
| Fresh lakes | 91000 |
| Atmosphere | 12900 |
| Swamp water | 11470 |
| Rivers | 2120 |
| Biological water | 1120 |
| Strip | Width (m) | Mean depth (m) | Mean velocity (m/s) |
|---|---|---|---|
| Left | 2 | 0.5 | 0.3 |
| Middle | 3 | 1 | 0.5 |
| Right | 1 | 0.5 | 0.2 |
| Solution | Solution mass (kg) | Salt concentration (g/kg solution) |
|---|---|---|
| Ocean-like | 1000 | 35 |
| Dilute | 2000 | 5 |
| Q (m^3/s) | Density (kg/m^3) | Heat capacity (J/kg/K) | Temperature difference (K) |
|---|---|---|---|
| 2 | 1025 | 4000 | 3 |
Worked model
The three subsection areas are 1, 3 and 0.5 m^2. Their flows are 0.3, 1.5 and 0.1 m^3/s, summing to 1.9 m^3/s. If unchanged for 120 s, the passing volume is 228 m^3. Separately, the solution masses contain 35 kg + 10 kg = 45 kg of salt; 45,000 g/3000 kg = 15 g/kg, not the unweighted 20 g/kg average.
Numerical calibration
- 68.6971 % from summed rounded freshwater volumes; report about 68.7%
- 1.9 m^3/s, three-strip sum
- 228 m^3 in 120 s if discharge stays constant
- 15 g/kg solution
- 11.25 g/kg after the specified freshwater addition
- 1.71 m^3/s, assumed endpoint lower bound
- 2.09 m^3/s, assumed endpoint upper bound
- 24.6 MW relative to the chosen reference
Attempt the assigned level
Try the tasks before reading the calibration. These are practice answers, not a secure examination; use a new dataset or changed assumption for the assessed transfer.
Foundation: typically grades 7-8
- Sum the freshwater table and estimate the fraction in ice caps, glaciers and permanent snow. State the largest liquid reservoir without counting saline groundwater as fresh.
- Calculate the salt mass in each solution and the flow through the Left strip, showing units.
Check after your attempt
- The sum is about 35.03 million km^3; ice caps/glaciers/permanent snow are about 68.7%. Fresh groundwater is the largest liquid freshwater reservoir. The quoted inventory does not establish available drinking water.
- The solutions contain 35 kg and 10 kg of salt. Left-strip area = 2 x 0.5 = 1 m^2; flow = 1 x 0.3 = 0.3 m^3/s.
High-school core: typically grades 9-10
- Calculate total channel discharge and the volume passing in two minutes at that constant flow. Explain why you cannot replace subsection velocities with the fastest velocity everywhere.
- Calculate mixed salinity and explain what happens if a further 1000 kg of salt-free water is added in the closed mass model.
Check after your attempt
- Total discharge = 0.3 + 1.5 + 0.1 = 1.9 m^3/s; two-minute volume = 228 m^3. Velocities differ across the 4.5 m^2 section, so using 0.5 m/s throughout would overestimate discharge.
- Initial mixture = 45,000/3000 = 15 g/kg. After adding 1000 kg salt-free water, salt stays 45 kg but solution mass becomes 4000 kg: 11.25 g/kg.
Honors extension: typically grades 11-12
- Bound total channel discharge when all stated mean velocities can vary by +/-10%, holding geometry exact. State the assumptions and omitted errors.
- Compute the separate heat-transport rate in MW and state why it is not a prediction of regional warming. Would the salinity table alone determine seawater density?
Check after your attempt
- Minimum = 0.9 x 1.9 = 1.71 m^3/s; maximum = 1.1 x 1.9 = 2.09 m^3/s. These simultaneous endpoint bounds omit depth/width errors and time variation; they are not a confidence interval.
- 1025 x 2 x 4000 x 3 = 24,600,000 W = 24.6 MW above the selected reference. Return flows, heat loss and storage are missing. Salinity alone does not fix density: temperature and pressure also matter.
History, reading, and writing connection
Contrast the historical global storage estimate with USGS's repeated flow-measurement method. Write why a stock, a flow, a salt concentration and an advected heat rate answer different questions, using one calculated example and a source for each type actually used.
Write in your own words or use an approved accessible equivalent. Cite a specific assigned section or figure, identify its evidence, and state one limitation or counterargument. Use the AI practice contract only for permitted coaching, never to invent observations or write the assessed response.
Transfer to a new case
A new two-strip channel has (width, depth, mean velocity) of (2 m, 1 m, 0.4 m/s) and (1 m, 0.5 m, 0.2 m/s). Foundation: find first-strip discharge. Core: sum both flows and find salinity for a separate closed mixture of 500 kg at 30 g/kg plus 1500 kg at 10 g/kg. Honors: bound total discharge with +/-10% velocity bounds and exact geometry. All levels: explain why this is not a drinking-water test.
Calibration: Foundation: first-strip Q = 2 x 1 x 0.4 = 0.8 m^3/s. Core: total Q = 0.8 + 0.1 = 0.9 m^3/s; salt = 30,000 g in 2000 kg, giving 15 g/kg. Honors: Q spans 0.81-0.99 m^3/s under those bounds. Neither flow nor salinity establishes potability or permission to ingest water.
Evidence to retain
At the agreed level retain the freshwater-category distinction, subsection or mass-balance work, selected heat/bounds analysis and transfer. These are evidence for the Water stores and flow and Ocean quantities science criteria. Label this supplied-data analysis, not practical stream measurement or water testing. Sources checked 2026-09-27.
Record units, calculations, source/date, uncertainty, and what is measured versus inferred. A simulation or supplied dataset must stay labeled as such. No field exposure or weather chasing; no water sampling, ingestion, or chemical tests; no solar viewing. Use supplied data and approved images or non-destructive indoor alternatives only. A worksheet does not demonstrate practical performance or authorize a real location or safety forecast.
Return to all eight learning pathways. Print this unit page for the student lessons; the linked five-page packet remains the separate assessment companion.
Unit mastery rubric
| Criterion | Developing | Proficient | Mastery |
|---|---|---|---|
| Water stores and flow | Confuses total fresh water, liquid storage or discharge. | Names categories but needs help with denominators or flow units. | At the agreed level, distinguishes frozen/fresh/saline stores and calculates supplied storage fractions or subsection discharge/bounds. |
| Ocean quantities | Confuses salt mass, concentration or heat flux. | Calculates with help but omits a denominator or model limit. | At the agreed level, defends salt mass/mixing or reference heat flux with units and limits; explains what drives ocean circulation. |
| Waves, tides & salinity | Confuses waves with currents or thinks tides are caused by wind. | Links tides to the Moon in general but not to its position, or treats salinity as fixed. | Relates tides to the Moon and Sun, distinguishes waves from currents, and explains what sets ocean salinity. |
| The ocean as a system | Treats the ocean as a still reservoir disconnected from weather and land. | Links the ocean to weather loosely but cannot connect currents, evaporation, and climate. | Connects ocean circulation, the water cycle, and climate into one moving system. |
| Water-model reasoning | Calls the worksheet a water test or safety result. | Reads the supplied model but overstates what it shows. | Defends the fresh channel/mixing transfer and distinguishes a model from practical measurement or a potability assessment. |
| Integration (cross-domain) | Makes no supported connection between the source and the science. | Uses the source but needs help connecting evidence, writing, or limitations to the science. | Independently connects History, Reading, and Writing using a cited source, appropriate evidence, a limitation, and a scientific explanation. |
Integration is reported separately and cannot lower the science grade or block a science demonstration pass. Science and practical criteria determine that pass. Use the integration guide's evidence checklist for the separately reported criterion.
“Explorers used trade winds and the Gulf Stream to cross the ocean; those currents move heat from the tropics toward the poles. Most total fresh water is stored in ice caps and glaciers. Most liquid fresh water is groundwater, not the rivers we can see.”
“The water cycle is water evaporating and then raining back down. The ocean just sits there — it’s separate from all that.”
Use the reference inventory and supplied cross-section, solution masses and heat model. Retain the agreed level’s work, units, limitations and transfer, then defend the reasoning. No water sampling, ingestion or testing is assigned; a worksheet cannot certify practical measurement or potability. Report integration separately.
A 5-page clipboard packet — unit overview, key terms, the mastery rubric, anchor examples, and a score sheet you can print and grade against.