Unit 06 · Digestive & Urinary Systems
The digestive and urinary systems do different but connected work: absorption transfers nutrients and water into the internal environment, while selective renal transport regulates its composition and excretion. Trace GI and nephron pathways, distinguish blood from filtrate, and explain filtration, reabsorption, secretion, and excretion. At the declared level, defend supplied clearance, fluid-compartment, electrolyte, and acid-base models without turning an educational case into diagnosis.
Choose the level before instruction. Retain the model/prepared-image identification target and use supplied transport records; any existing specimen or enzyme work requires its separate approved procedure and alternative. No urine collection, blood testing, invasive task, or fluid prescription is assigned. Clearance and acid-base practice deepen these criteria; they are not new required practicals.
Student learning: Trace absorption and nephron transport through fluid, electrolyte, and acid balance
Choose the level by readiness, not age alone, and record it before instruction. Foundation, core, and honors tasks are study pathways, not an AP course or a promise of college credit. The instructor retains practical assessment and the published science rubric; integration is reported separately.
Prerequisites: Membrane polarity, osmosis, blood flow, concentration × volume, and Unit 04’s bicarbonate model. Foundation follows pathways and conservation; core uses clearance; honors balances compartments and acid equivalents.
Suggested sequence: read and discuss the explanation; attempt the worked model; analyze the data at your selected level; check the answers; then complete the source-linked response and a fresh transfer question. These activities supplement, not replace, supervised practical work and the full-year schedule.
Assigned reading and focus
- OpenStax Anatomy & Physiology 2e, 23.7: Chemical Digestion and Absorption. Read Absorption and Water Absorption. Trace sugars/amino acids to portal blood and most absorbed long-chain lipids through lymph; identify where most water is absorbed.
- OpenStax Anatomy & Physiology 2e, 25.4: Microscopic Anatomy of the Kidney. Study the renal-corpuscle and nephron figures. Separate the blood route from the filtrate route and a microscopic image from its schematic.
- OpenStax Anatomy & Physiology 2e, 25.5: Physiology of Urine Formation. Read filtration forces, GFR, and the urine-production calculations. Use only the fictional inputs below, not clinical reference ranges for a learner.
- OpenStax Anatomy & Physiology 2e, 25.6: Tubular Reabsorption. Read segment-specific transport, countercurrent multiplication, and secretion. Distinguish concentration, filtered load, and excreted amount.
- OpenStax Anatomy & Physiology 2e, 25.8: Endocrine Regulation of Kidney Function. Read renin–angiotensin–aldosterone, ADH, and natriuretic hormones for mechanisms, not medication discussion.
- OpenStax Anatomy & Physiology 2e, 26.2: Water Balance. Read osmoreception and water-output regulation. Keep osmolarity (per litre) distinct from osmolality (per kilogram); no intake target is assigned.
- OpenStax Anatomy & Physiology 2e, 26.3: Electrolyte Balance. Read the roles of sodium, potassium, calcium, and phosphate. Do not use reference tables as personal diagnostic thresholds or dietary prescriptions.
- OpenStax Anatomy & Physiology 2e, 26.4: Acid-Base Balance. Read renal regulation and bicarbonate conservation alongside Unit 04. Explain why urine pH alone cannot count all excreted acid.
- Harada and Inagaki: Role of sodium-glucose transporters in glucose uptake of the intestine and kidney (2012). Read the opening transporter definitions and the paragraph locating renal SGLT1/SGLT2. Contrast coupled transport with GLUT-mediated diffusion. Mechanism only: the later treatment discussion is outside this course; our constants and records below are invented, not copied experiments.
Learn the science
Food passes mouth → pharynx → esophagus → stomach → small intestine → large intestine → rectum → anus. Mechanical breakdown and mixing increase access; chemical digestion hydrolyzes molecules. The liver makes bile, the gallbladder stores/concentrates it, and the exocrine pancreas supplies enzymes and bicarbonate. Bile helps emulsify fats but is not an enzyme. Pancreatic endocrine hormones enter blood, not the food tube.
Villi and enterocyte microvilli expand exchange area. Most carbohydrate digestion products and amino acids enter villus capillaries and portal blood; most absorbed long-chain lipids are packaged into chylomicrons and enter lacteals before returning to blood. The small intestine absorbs most nutrients and most water; the colon reclaims much of the remaining water. Luminal water includes secretions as well as intake, so a GI-flow ledger is not a drinking-water prescription.
In a kidney, cortex surrounds medulla, which contains pyramids draining toward the renal pelvis. Corpuscles are in cortex; loops extend to varying depths toward the medulla. Blood passes renal arterial branches → afferent arteriole → glomerular capillaries → efferent arteriole → peritubular capillaries or vasa recta. Filtrate instead enters Bowman’s space → proximal tubule → nephron loop → distal tubule → connecting segment/collecting duct → papillary outflow → calyces/pelvis → ureter → bladder → urethra. The collecting duct receives fluid from several nephrons; blood does not flow down the tubular lumen.
Filtration moves water and small solutes from glomerular blood into Bowman’s space, driven by net filtration pressure across a selective barrier; cells and most large proteins remain in blood. GFR is filtrate volume per time, not urine output and not the fraction of whole blood that disappears. Hydrostatic and oncotic pressures and the filtration coefficient matter. Autoregulation buffers changes only over a limited range; doubling systemic pressure does not imply doubling GFR.
Reabsorption moves material from tubule toward interstitium and blood; secretion moves material from blood/interstitium into the tubular fluid. Excretion is what leaves in urine. For a freely filtered solute at steady state: excreted amount/time = GFR × plasma concentration − reabsorbed amount/time + secreted amount/time. Distinguish this from concentration: a dilute urine can still contain a substantial daily amount if urine flow is high.
The proximal tubule reclaims much filtered sodium, water, glucose, amino acids, and bicarbonate; apical cotransport uses gradients maintained in part by basolateral sodium-potassium ATPase. Transport capacity is finite. The descending limb is relatively water-permeable; the thick ascending limb reabsorbs salt but is poorly permeable to water. Repeated countercurrent flow and salt transport help build the medullary gradient, while vasa recta countercurrent exchange helps preserve it and urea recycling contributes. A colored model cannot show these transport rates directly.
Later nephron segments fine-tune excretion. ADH is synthesized in the hypothalamus and released from the posterior pituitary; it increases collecting-duct water permeability through aquaporin insertion when the gradient permits water recovery. Aldosterone promotes distal sodium reabsorption and potassium secretion; water retention also depends on water availability, permeability, and other controls. Reduced effective perfusion can stimulate renin, leading through angiotensin to vascular and hormonal effects. Atrial natriuretic peptide favors sodium excretion in an appropriate volume context. These loops are not interchangeable: concentration and circulating volume are different controlled variables.
Sodium salts dominate extracellular osmotic balance, whereas potassium is chiefly intracellular. Changing potassium gradients can change muscle and neuronal electrical behavior (Units 02 and 05), but a single number cannot identify its cause. Kidneys also contribute erythropoietin for red-cell production and activate vitamin D, linking renal function to oxygen carriage and calcium/bone physiology. These are explanatory connections, not diagnoses.
Clearance C = urine concentration × urine flow/plasma concentration is a virtual volume of plasma cleared of a marker per time, not a parcel of plasma physically removed. Clearance equals GFR only for a freely filtered marker that is neither reabsorbed nor secreted or otherwise produced/lost by the kidney, with appropriate steady state and complete timed collection assumed. Secretion raises a marker’s clearance above GFR; reabsorption lowers it. The second record explicitly violates the ideal-marker assumption.
In the two-compartment model, water equilibrates across cell membranes, intracellular solute stays intracellular, and the stipulated extracellular solute stays extracellular. Losing pure water concentrates both compartments and shifts water out of cells. Losing an isosmotic extracellular solution removes water and solute together and chiefly contracts extracellular volume without that osmotic shift. The values below omit ongoing intake/output, osmotically inactive stores, active regulation, and nonideal solution effects; they are not a fluid prescription or rehydration plan.
Renal acid-base regulation includes reclaiming filtered bicarbonate and excreting acid with buffers such as phosphate and ammonium. Reclaiming previously filtered bicarbonate prevents its loss; net acid excretion can be associated with adding new bicarbonate to blood. In the supplied balance, net acid excretion = ammonium + titratable acid − bicarbonate excretion, with all terms expressed as H+ equivalents. Urine pH alone cannot reveal this total because it does not count buffered acid or urine volume. Respiratory compensation has its own limits and time scale, as Unit 04 showed.
SGLT1 and SGLT2 are sodium-glucose cotransporters, not ATP-hydrolyzing pumps. Apical SGLT2 supports bulk glucose recovery in the early proximal tubule; SGLT1 supports recovery later in the proximal tubule and also absorbs glucose and galactose in the intestinal brush border. SGLT1 is commonly described as higher-affinity/lower-capacity and SGLT2 as lower-affinity/higher-capacity in this comparison, but measured values depend on conditions and expression. They are not interchangeable with GLUT5, which facilitates intestinal fructose entry, or GLUT2, which supports basolateral glucose exit in enterocytes and early proximal cells.
This is secondary active transport: downhill sodium movement can drive uphill glucose entry. The basolateral sodium-potassium ATPase spends ATP to maintain the sodium gradient; SGLT does not directly split ATP on each glucose-transfer step. If that electrochemical driving force changes, a formula that assumed it fixed no longer predicts the flux. A kidney micrograph cannot reveal either transporter identity or its current activity.
For each isolated ideal membrane patch use J = Jmax × C/(Khalf + C), where C is luminal glucose in mmol/L and J is glucose flux in nmol per square centimetre per minute. The invented constants describe separate SGLT1-only and SGLT2-only patches with fixed transporter abundance, sodium gradient, voltage, temperature, and rapid steady state. They are not measured human kinetic constants. Khalf is the C giving half that patch’s limiting flux; a smaller value does not by itself guarantee greater flux at every concentration. The limit Jmax is approached, not exactly attained at finite C in this equation.
The separate aggregate kidney model uses plasma concentration P in mg/mL, GFR in mL/min, and an ideal total glucose-reabsorption capacity Tm in mg/min. Filtered F = P × GFR; reabsorbed R = min(F, Tm); excreted E = F − R. Assume freely filtered glucose, no secretion, no synthesis or metabolism within the modeled accounting boundary, and steady state. Plasma P is not the luminal C in the isolated-patch experiment. Tm is not Khalf, and adding patch Jmax values without membrane areas or segment delivery would be dimensionally wrong.
The sharp corner at P = Tm/GFR assumes identical nephrons and complete recovery below capacity. Real excretion can begin gradually before a whole-kidney plateau: this rounded transition is called splay and reflects heterogeneous delivery/capacity and non-instantaneous saturation. The two-group toy model demonstrates heterogeneity only, not the complete renal curve. These are educational ledgers, not real tests, diagnostic thresholds, clinical dosing, or treatment advice.

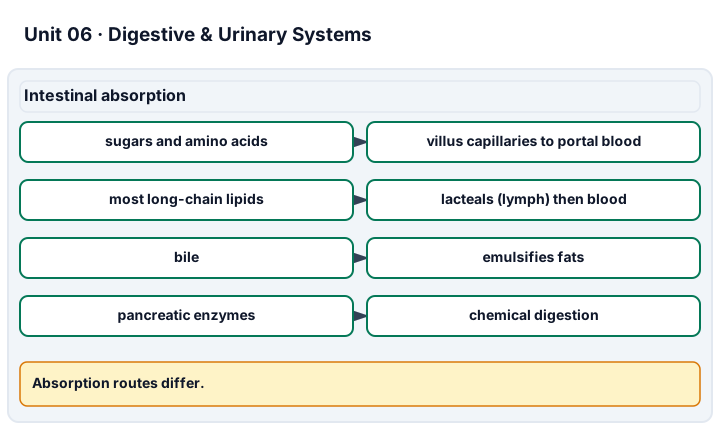
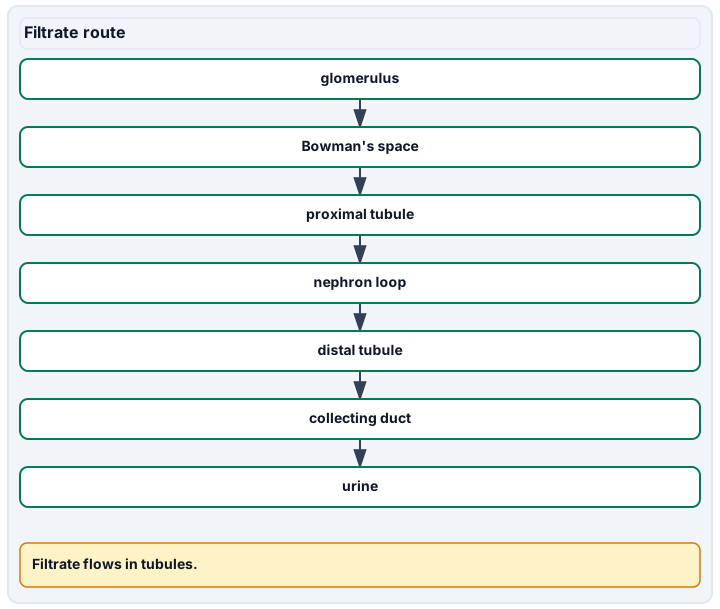
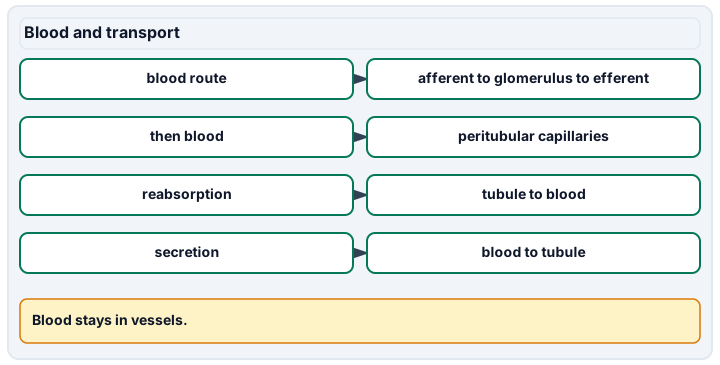
Diagram description
Water-soluble nutrients enter villus capillaries and portal blood, while most long-chain lipids enter lacteals before blood. Filtrate flows from glomerulus into Bowman's space and through nephron tubules to urine. Blood remains in vessels, while reabsorption returns material to blood and secretion adds material to tubule fluid.
Data, provenance, and assumptions
| Boundary | Water flow (mL/day) |
|---|---|
| Entering small intestine | 9000 |
| Entering colon | 1000 |
| Leaving in feces | 100 |
| Record | GFR (mL/min) | Renal plasma flow (mL/min) | Urine flow (mL/min) |
|---|---|---|---|
| R | 120 | 600 | 1.2 |
| Marker | Urine concentration (mg/mL) | Plasma concentration (mg/mL) | Urine flow (mL/min) |
|---|---|---|---|
| M: ideal | 20 | 0.2 | 1.2 |
| S: secreted | 22 | 0.2 | 1.2 |
| Solute | GFR (mL/min) | Plasma concentration (mg/mL) | Reabsorption (mg/min) | Secretion (mg/min) |
|---|---|---|---|---|
| Glucose | 120 | 1 | 120 | 0 |
| Z | 120 | 0.1 | 8 | 3 |
| M | 120 | 0.2 | 0 | 0 |
| Compartment | Initial volume (L) | Initial osmolarity (mOsm/L) |
|---|---|---|
| Intracellular | 28 | 300 |
| Extracellular | 14 | 300 |
| Scenario | Water removed (L) | Osmolarity of removed fluid (mOsm/L) |
|---|---|---|
| Pure water | 3 | 0 |
| Isosmotic extracellular fluid | 3 | 300 |
| Record | Ammonium (mmol/day) | Titratable acid (mmol/day) | Bicarbonate excretion (mmol/day) |
|---|---|---|---|
| A | 30 | 20 | 2 |
| Patch | Jmax (nmol/cm²/min) | Khalf (mmol/L) |
|---|---|---|
| SGLT1-only | 12 | 1 |
| SGLT2-only | 36 | 6 |
| Condition | Luminal glucose C (mmol/L) |
|---|---|
| Zero | 0 |
| Low | 1 |
| Intermediate | 3 |
| Comparison | 6 |
| Doubled comparison | 12 |
| State | Plasma P (mg/mL) | GFR (mL/min) | Total Tm (mg/min) |
|---|---|---|---|
| A | 0.6 | 100 | 180 |
| B | 1.2 | 100 | 180 |
| C | 1.8 | 100 | 180 |
| D | 2.4 | 100 | 180 |
| E | 3 | 100 | 180 |
| Group | Group GFR (mL/min) | Group Tm (mg/min) |
|---|---|---|
| Lower-capacity group | 50 | 60 |
| Higher-capacity group | 50 | 120 |
Worked model
Small intestine absorbs 9,000 − 1,000 = 8,000 mL/day and colon 1,000 − 100 = 900 mL/day in this ledger. Marker M clearance is (20 mg/mL × 1.2 mL/min)/(0.2 mg/mL) = 120 mL/min; S gives 132 mL/min and cannot be equated to GFR. Filtration fraction = 120/600 = 20% of renal plasma flow. Filtered water is 120 × 1,440/1,000 = 172.8 L/day, while urine is 1.728 L/day, so 99% of filtered water is recovered. Z excretion is 120 × 0.1 − 8 + 3 = 7 mg/min. After pure-water loss, total osmoles remain 12,600 mOsm in 39 L: 323.076923 mOsm/L; intracellular volume is 8,400/323.076923 = 26 L and extracellular volume 4,200/323.076923 = 13 L. Isosmotic loss instead leaves 28 L intracellular and 11 L extracellular at 300 mOsm/L. Net acid removal is 30 + 20 − 2 = 48 mmol H+ equivalents/day. For the SGLT1 patch at C = 6, J = 12 × 6/(1 + 6) = 10.285714 nmol/cm²/min. For the SGLT2 patch at C = 6 and 12, J is 18 and 24, respectively: doubling concentration increases flux by (24/18 − 1) × 100 = 33.333333%, not 100%. At plasma P = 2.4 in the separate kidney ledger, F = 240, R = 180, and E = 60 mg/min. At P = 1.8 the identical-nephron model gives E = 0, but the heterogeneous groups each filter 90 mg/min and reabsorb 60 and 90: E = 30 + 0 = 30 mg/min. Their combined available Tm is 180, yet uneven capacity prevents complete recovery of the 180 filtered.
Numerical calibration
- 8000 mL/day
- 900 mL/day
- 0 mg/min
- 7 mg/min
- 120 mL/min
- 132 mL/min
- 20 percent
- 172.8 L/day
- 99 percent
- 323.076923 mOsm/L
- 26 L
- 13 L
- 11 L
- 48 mmol H+ equivalents/day
- 10.285714 nmol/cm²/min
- 18 nmol/cm²/min
- 24 nmol/cm²/min
- 33.333333 percent flux increase
- 240 mg/min
- 60 mg/min
- 30 mg/min
Attempt the assigned level
Try the tasks before reading the calibration. These are practice answers, not a secure examination; use a new dataset or changed assumption for the assessed transfer.
Foundation
- Trace a food molecule, a drop of blood, and a drop of filtrate on separate supplied diagrams. Locate liver, gallbladder, pancreas, cortex, medulla, and pelvis.
- Use arrows to distinguish filtration, reabsorption, secretion, and excretion. Calculate small-intestinal and colonic water absorption.
- Explain why 120 mL/min filtrate does not mean 120 mL/min urine, and why a printed nephron cannot prove a transport rate.
- Locate intestinal SGLT1 and renal SGLT1/SGLT2 on a supplied membrane/nephron drawing, keeping these model labels separate from what the atlas photograph resolves. Compute F, R, E for state A.
Check after your attempt
- Food follows the GI lumen; absorbed sugars reach portal blood, whereas many long-chain lipids first enter lymph. Renal blood follows afferent/glomerular/efferent vessels; filtrate follows the tubular route. Gallbladder stores bile made by liver.
- Filtration: blood to Bowman’s space; reabsorption: tubule toward blood; secretion: blood toward tubule; excretion: exit in urine. Absorption is 8,000 mL/day in small intestine and 900 in colon.
- Most filtered water returns to blood by reabsorption. Structures locate a process, but independent flow/concentration evidence is needed to quantify it.
- SGLT1: intestinal apical uptake and later proximal renal recovery; SGLT2: early proximal renal recovery. In state A, F = 60, R = 60, E = 0 mg/min. A source photo can show a tubule, not identify its cotransporter molecules.
Core
- Compute both marker clearances, filtration fraction, daily filtered water, daily urine, and percent water recovered. Identify why S is not a GFR marker.
- Compute filtered and excreted glucose and Z rates. Predict the qualitative effect of exceeding a fixed glucose-reabsorption capacity.
- Explain how ADH and aldosterone differ, and connect renal sodium/water regulation to circulation and potassium handling to membrane excitability.
- Calculate both patch fluxes at all five C values and sketch curves with units. Explain the indirect ATP dependence and why sixfold concentration from 1 to 6 does not give sixfold flux.
- Complete F/R/E for states A–E and distinguish Khalf, Jmax, and total Tm.
Check after your attempt
- M 120 mL/min; S 132 mL/min; filtration fraction 20%; filtered water 172.8 L/day; urine 1.728 L/day; recovered 99%. Secretion adds S to urine and biases its clearance upward.
- Glucose filtered 120 mg/min and excreted 0; Z filtered 12 mg/min and excreted 7. If filtered glucose exceeds a finite reabsorptive capacity with other conditions unchanged, glucose remains in tubular fluid; this is not a diagnosis from a real sample.
- ADH primarily adjusts water permeability; aldosterone adjusts distal sodium recovery and potassium secretion. ECF volume affects circulation, while potassium gradients influence electrical function; effects depend on other intact mechanisms.
- SGLT1 fluxes are 0, 6, 9, 10.285714, 11.076923; SGLT2 fluxes are 0, 5.142857, 12, 18, 24 nmol/cm²/min. The sodium gradient, maintained by ATPase, powers cotransport; finite carrier turnover makes the curve nonlinear.
- F: 60, 120, 180, 240, 300; R: 60, 120, 180, 180, 180; E: 0, 0, 0, 60, 120 mg/min. Khalf is a concentration, Jmax a flux per area, and total Tm an amount/time. None is an interchangeable clinical threshold.
Honors extension: typically grades 11-12
- Conserve water and compartment-confined osmoles to solve both fluid-loss scenarios. Explain why an unchanged osmolarity does not prove unchanged extracellular volume.
- Calculate net acid excretion, distinguish reclaimed from new bicarbonate, and compare renal time scales with respiratory responses.
- Suppose only marker M urine concentration changes from 20 to 10 mg/mL while urine flow doubles and plasma concentration is unchanged. Predict clearance; state one reason a non-steady-state collection could invalidate it.
- At P = 1.8, recompute the two-group kidney and compare with the aggregate model. Find each group’s ideal P threshold and explain how heterogeneity introduces a transition before full aggregate saturation.
Check after your attempt
- Pure water loss: 39 L total, 323.076923 mOsm/L, ICF 26 L, ECF 13 L. Isosmotic loss removes 900 mOsm and 3 L, leaving ICF 28 L and ECF 11 L at 300 mOsm/L. Concentration can stay unchanged while amount/volume fall.
- Net acid excretion is 48 mmol H+ equivalents/day. Reclaiming filtered bicarbonate prevents losing existing buffer; excreting newly generated acid equivalents can add new bicarbonate. Full renal adjustment generally takes hours to days, not the minutes of respiratory adjustment.
- 10 × 2.4/0.2 = 120 mL/min: dilution alone did not change clearance. Changing plasma concentration during the collection or incomplete collection defeats the simple matched steady-state assumption.
- Group thresholds are 60/50 = 1.2 and 120/50 = 2.4 mg/mL. At P = 1.8, total excretion is 30 mg/min rather than zero, despite equal total GFR and Tm. The abrupt bends in this two-group construction only approximate part of splay; real kinetics, nephron distributions, and downstream delivery are omitted.
History, reading, and writing connection
Compare the absorption account in OpenStax 23.7 with the renal evidence in 25.5–25.6. Write a cited correction of “the colon absorbs the water and the kidney just filters waste.” Model response: the GI ledger locates most absorption in the small intestine, while matched filtrate/urine amounts require recovery and selective transport, not a passive waste sieve. Explain why our arithmetic is an original synthetic illustration of modern mechanisms, not Beaumont’s historical measurements. If discussing that history, distinguish a person’s consent from an investigator’s access to a body.
Write in your own words or use an approved accessible equivalent. Cite a specific assigned section or figure, identify its evidence, and state one limitation or counterargument. Use the AI practice contract only for permitted coaching, never to invent observations or write the assessed response.
Transfer to a new case
A fresh ideal marker has urine concentration 12 mg/mL, plasma concentration 0.2 mg/mL, and urine flow 1.5 mL/min. A second solute is filtered at 9 mg/min, reabsorbed at 7, and secreted at 1. Find clearance and the second solute’s excretion; state which assumptions make clearance a GFR estimate. Additional fresh case: For a fresh ideal SGLT2-only patch, Jmax = 30 nmol/cm²/min and Khalf = 5 mmol/L. Compare C = 5 and 15 mmol/L. Would the old curve still apply if the sodium gradient collapsed?
Calibration: Marker clearance = 12 × 1.5/0.2 = 90 mL/min. Second-solute excretion = 9 − 7 + 1 = 3 mg/min. Equating clearance with GFR requires a freely filtered, neither reabsorbed nor secreted marker with no other renal gain/loss and matched complete steady-state inputs. Fluxes are 15 and 22.5 nmol/cm²/min: threefold C gives only 1.5-fold J. No: changing sodium driving force violates the fixed-gradient condition. The formula cannot predict the new flux without a model that accounts for the altered gradient.
Evidence to retain
Retain labeled but separate vascular/tubular routes, the four transport arrows, complete mass and fluid balances, unit cancellation, and a marker-assumption statement. These records are not urine collection, biochemical testing, diagnosis, or a clinical procedure. Add the two labeled patch curves, the complete aggregate ledger, the heterogeneous comparison, and a dimensional check. Keep microscopy evidence separate from molecular transporter labels; no urine sample, personal measurement, or dosing calculation is assigned.
Record units, calculations, source/date, uncertainty, and what is measured versus inferred. A simulation or supplied dataset must stay labeled as such. Educational fictional cases only: no diagnosis of the learner, real patient uploads, treatment or dosing prescriptions, invasive tests, medical procedure instructions, exercise challenges, breath-holding, or forced personal measurements. No personal, reproductive, or health disclosure is required. Use supplied data and models or an instructor-approved noninvasive demonstration with an agreed alternative. Textbook equations do not certify diagnostic or professional skill; this elective is not a licensed medical course, an AP course, or a claim of college credit.
Return to all eight learning pathways. Print this unit page for the student lessons; the linked five-page packet remains the separate assessment companion.
Unit mastery rubric
| Criterion | Developing | Proficient | Mastery |
|---|---|---|---|
| Digestive tract & accessory organs | Cannot name the organs of the alimentary canal in order, or confuses them with accessory organs. | Names the major organs but cannot place the accessory organs (liver, gallbladder, pancreas) or their role. | Traces the alimentary canal from mouth to anus in order and places the accessory organs that feed into it. |
| Digestion & absorption | Confuses mechanical/chemical digestion or the main sites of absorption. | Names processes but needs help tracing nutrients or balancing supplied water flows. | Separates mechanical/chemical digestion, traces portal versus lymphatic nutrient routes, and identifies the small intestine as the main site of nutrient and water absorption; balances the supplied GI ledger. |
| Kidney structure & nephron transport | Confuses blood/filtrate routes or assigns ATP hydrolysis directly to SGLT. | Orders segments but needs help with permeability, SGLT roles, or sodium-gradient coupling. | Traces separate blood and filtrate routes; explains loop permeability and proximal SGLT2/SGLT1 recovery driven indirectly by an ATPase-maintained sodium gradient. |
| Excretion, clearance & homeostasis | Equates concentration, filtrate, urine, and clearance or assumes unlimited transport. | Balances some quantities but needs help with units, saturation, or model limits. | Defends assigned solute, clearance, fluid/acid, and saturation calculations with units; explains hormone roles, Jmax/Khalf/Tm, and honors splay limits. |
| Structure identification & evidence | Cannot interpret the approved model, specimen, or image. | Names a structure but needs help supporting the identification or distinguishing inferred function. | Defends a digestive/urinary identification with two features visible in the selected medium; distinguishes observed structure from transport inferred from supplied data, without claiming unperformed techniques. |
| Integration (cross-domain) | Makes no supported connection between the source and the science. | Uses the source but needs help connecting evidence, writing, or limitations to the science. | Independently connects History, Reading, and Writing using a cited source, appropriate evidence, a limitation, and a scientific explanation. |
Integration is reported separately and cannot lower the science grade or block a science demonstration pass. Science and practical criteria determine that pass. Use the integration guide's evidence checklist for the separately reported criterion.
“The supplied villi support a small-intestine identification; the renal corpuscle belongs in cortex. Clearance of the ideal marker is 20 × 1.2 / 0.2 = 120 mL/min, not urine output. Solute Z is filtered at 12, reabsorbed at 8, and secreted at 3 mg/min, so excretion is 7 mg/min.”
“It’s some kind of gut tube. The kidney just cleans the blood and makes pee, I think.”
Locate and defend the assigned structures in the approved medium, then connect them to the selected conservation model. A labeled schematic does not measure filtration or prove a microscopic feature is visible. Record the selected level and alternative; these fictional cases do not authorize medical tests or diagnostic claims.
A 5-page clipboard packet — unit overview, key terms, the mastery rubric, anchor examples, and a score sheet you can print and grade against.