Unit 04 · Genetics & Heredity
What does a defined pea cross predict? Use Pp x Pp flower color, with purple dominant over white under the stated one-locus assumptions. Distinguish genes, alleles, phenotype, environment and learned behavior; compare probabilities with supplied counts rather than inferring human-family genotypes.
Student learning: What does the defined pea cross predict, and what does it not?
Choose the level by readiness, not age alone, and record it before instruction. Foundation, core, and honors tasks are study pathways, not an AP course or a promise of college credit. The instructor retains practical assessment and the published science rubric; integration is reported separately.
Prerequisites: Fractions and percentages, cells and DNA, and the distinction between a model probability and a counted outcome.
Suggested sequence: read and discuss the explanation; attempt the worked model; analyze the data at your selected level; check the answers; then complete the source-linked response and a fresh transfer question. These activities supplement, not replace, supervised practical work and the full-year schedule.
Assigned reading and focus
- OpenStax Biology 2e, 12.1: Mendel's Experiments and the Laws of Probability. Read Mendel's Model System, Mendelian Crosses, and Garden Pea Characteristics Revealed the Basics of Heredity. Locate the F2 flower counts of 705 violet and 224 white. Distinguish Mendel's 1860s observations from our later P/p notation. Checked 2026-09-27.
- OpenStax Biology 2e, 4.3: Eukaryotic Cells. Study Figure 4.8 and the sections The Plasma Membrane, The Cytoplasm, The Nucleus, Mitochondria, and Plant Cells. Use the diagram to learn functions, not as proof that every labeled part is visible with a school microscope. Checked 2026-09-27.
Learn the science
The defined pea cross is Pp x Pp for flower color: P gives purple (called violet in the source), p gives white. Assume one locus, complete dominance, diploid parents, equal P and p gamete probabilities, random fertilization, independent offspring trials, and equal survival and scoring of all genotypes. These are model conditions, not claims about all traits.
A square with P and p on both axes gives PP, Pp, Pp, pp. Genotype probabilities are 1/4, 1/2, 1/4; purple probability is 3/4 and white probability is 1/4. One-in-four is a chance for each offspring, not a rule that each group of four contains exactly one white-flowered plant.
Mendel began with true-breeding parental lines and then examined later generations, including F2 from self-fertilized heterozygotes. His published flower-color counts below are phenotype counts: a purple phenotype cannot distinguish PP from Pp. The genotype counts in our separate simulation are known only because the model explicitly records alleles.
Genes are DNA sequences; alleles are versions. Environment can affect phenotype, and learned behaviors can be transmitted by teaching without being encoded as the learned skill in a gamete. Do not infer family genotypes from tongue rolling, earlobes, eye color, or resemblance.

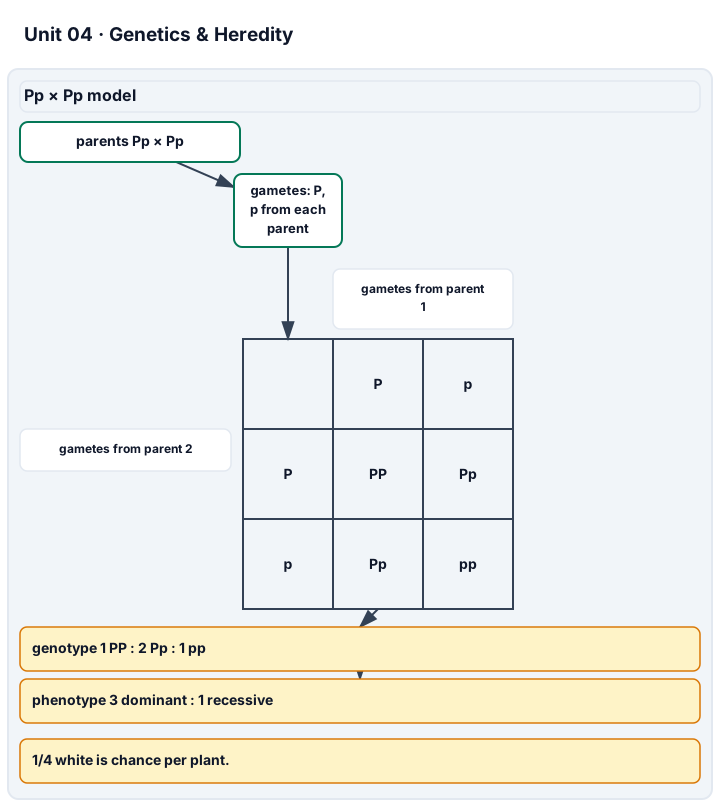
Diagram description
P and p gametes from both heterozygous parents form the Punnett grid. Under the stated one-locus complete-dominance model, genotype and phenotype counts are computed from grid cells. The model predicts chance per offspring, not a guaranteed count in every group of four. Assumptions include equal gamete probabilities, random fertilization, independent offspring trials, and equal survival/scoring.
Data, provenance, and assumptions
| Flower phenotype | Reported F2 plants |
|---|---|
| Purple (source: violet) | 705 |
| White | 224 |
| Recorded model genotype | Offspring count |
|---|---|
| PP | 18 |
| Pp | 41 |
| pp | 21 |
Worked model
The source total is 705 + 224 = 929 plants. White fraction is 224/929 = 24.11%, near but not exactly 25%. The model expects 0.25 x 80 = 20 white offspring in 80; the synthetic sample has 21. A one-off mismatch does not by itself disprove the assumptions, and a close match does not prove them.
Numerical calibration
- 929 reported F2 plants in this flower-color comparison
- 24.11 % white in the historical count
- 0.25 white probability per Pp x Pp offspring
- 20 expected white model offspring in 80
Attempt the assigned level
Try the tasks before reading the calibration. These are practice answers, not a secure examination; use a new dataset or changed assumption for the assessed transfer.
Foundation: typically grades 7-8
- Draw the labeled Pp x Pp square and state the genotype and flower-color probabilities. Explain one-in-four without promising an exact count.
- Classify each statement as inherited allele, environmental effect, or learned behavior: receiving p in a gamete; a plant wilting in dry soil; a pet learning a cue. Explain why the third is not a Mendelian flower-color cross.
Check after your attempt
- PP, Pp, Pp, pp; 1:2:1 genotypes and 3:1 expected phenotypes under the stated conditions. Independent trials can give zero or several white plants in four.
- Inherited allele; environmental response; learned behavior. These are not three examples of one-locus complete dominance.
Core
- Make separate observed-versus-expected displays for the historical flower phenotypes and the synthetic sample. Calculate each total, the historical white percentage, and the expected white count in 80.
- Explain why 705 purple plants cannot all be assigned PP; name two model assumptions that should be checked before blaming a mismatch on heredity.
Check after your attempt
- Historical total 929, white 24.11%; expected historical white 232.25 and purple 696.75 (expectations need not be integers). Synthetic total 80, purple 59 and white 21 versus expected 60 and 20.
- Both PP and Pp are purple. Verify parent genotypes, random fertilization, equal survival, and unbiased counting; sampling variation is also possible.
Extension
- For the same independent Pp x Pp model, calculate the chance that none of four offspring is white.
- Change only the parental cross to Pp x pp. Predict both phenotypes and explain why this is a transfer case rather than a revision of the original cross.
Check after your attempt
- (3/4)^4 = 81/256, about 31.64%; the nonzero chance directly contradicts a guaranteed one-white-in-four claim.
- Half Pp purple, half pp white under the same dominance and sampling assumptions. State the new parents explicitly; do not silently mix the two models.
History, reading, and writing connection
Original response: Write a short evidence note for a museum label about Mendel's 1860s pea work. Cite OpenStax 12.1, include 705 and 224 with the 929 denominator, and contrast observed 24.11% white with the Pp x Pp prediction of 25%. Explain why countable variation challenged blending, why modern allele/DNA language is a later explanation, and why phenotype counts do not reveal every genotype. Do not use human-family trait analogies.
Write in your own words or use an approved accessible equivalent. Cite a specific assigned section or figure, identify its evidence, and state one limitation or counterargument. Use the AI practice contract only for permitted coaching, never to invent observations or write the assessed response.
Transfer to a new case
A new Pp x Pp batch has 12 white plants among 40. Is inheritance broken, or did every group of four violate a rule?
Calibration: Neither conclusion follows. The expected count is 10, but 12 is possible under a probabilistic model. Retain actual counts and consider sampling and the model assumptions rather than imposing exact quartets.
Evidence to retain
Traits, genes & DNA: distinguish DNA, gene, allele and phenotype. Inherited vs. learned traits: the three classified statements and environmental qualification. Dominant & recessive traits: explain P/p under complete dominance. Punnett squares & prediction: labeled square, probabilities and count comparison. Lab technique (pea-cross model): separately observe the learner constructing and explaining a new allele model, retaining any actual simulated trial log; supplied counts do not show they ran trials. Keep historical and synthetic records separate, cite the source and date, and report the museum-label integration response separately.
Record units, calculations, source/date, uncertainty, and what is measured versus inferred. A simulation or supplied dataset must stay labeled as such. This is reading, paper-model, and data work, not authorization to collect pond water, swab people, culture organisms, dissect, expose wildlife, or ingest study materials. Use only instructor-approved prepared slides, images, or in-room materials for separately observed practical skills. Supplied data are not your observations.
Return to all eight learning pathways. Print this unit page for the student lessons; the linked five-page packet remains the separate assessment companion.
Unit mastery rubric
| Criterion | Developing | Proficient | Mastery |
|---|---|---|---|
| Traits, genes & DNA | Thinks traits appear at random with no cause. | Says genes carry traits but can’t explain DNA’s role. | Explains that genes are instructions carried by DNA and passed from parents to offspring. |
| Inherited vs. learned traits | Calls every trait, even a learned skill, genetically inherited. | Sorts simple examples but overlooks environmental effects. | Distinguishes inherited alleles, environmental effects and learned behavior without inferring human genotypes. |
| Dominant & recessive traits | Treats dominant as stronger or more common. | Reads P/p but omits the complete-dominance condition. | Explains purple and white phenotypes for PP, Pp and pp in the defined one-locus, complete-dominance pea model. |
| Punnett squares & prediction | Cannot set up the stated cross. | Fills the square but treats expected counts as guarantees. | Uses Pp x Pp to predict probabilities, compare counts and state independence and equal-survival assumptions. |
| Lab technique (pea-cross model) | Omits parent alleles or a record of the modeled outcomes. | Builds a model but needs help separating supplied counts from trials actually run. | Constructs and explains a defined pea-cross model, retaining an honest record and comparing outcomes with predictions. |
| Integration (cross-domain) | Makes no supported connection between the source and the science. | Uses the source but needs help connecting evidence, writing, or limitations to the science. | Independently connects History, Reading, and Writing using a cited source, appropriate evidence, a limitation, and a scientific explanation. |
Integration is reported separately and cannot lower the science grade or block a science demonstration pass. Science and practical criteria determine that pass. Use the integration guide's evidence checklist for the separately reported criterion.
“In this pea cross, purple flowers are dominant and both parents are Pp. My square gives PP, Pp, Pp, and pp, so each offspring has a one-in-four chance of white flowers. That is a probability, not a promise that exactly one of four plants will be white.”
“Purple is stronger, so every plant must be purple. I filled four boxes but do not know what they predict.”
You demonstrate this unit with a defined pea cross or simulated alleles, comparing observed counts with predicted probabilities and explaining the model aloud. Tongue rolling and earlobe shape are not reliable single-gene examples; do not infer family genotypes from them. A criterion counts as mastered only when you can make the prediction and explain its assumptions. Mastery is demonstrated, not awarded.
A 5-page clipboard packet — unit overview, key terms, the mastery rubric, anchor examples, and a score sheet you can print and grade against.