Unit 07 · Ecosystems & Interdependence
No living thing survives alone. This unit is about ecosystems — the web of connections between living things and their surroundings. You’ll sort producers, consumers, and decomposers, trace how energy flows through food chains and food webs, and see how living and non-living parts depend on one another. Mastery means you can map who eats whom and predict what happens when one part of the system changes.
Student learning: Yellowstone: which claims does the evidence support?
Choose the level by readiness, not age alone, and record it before instruction. Foundation, core, and honors tasks are study pathways, not an AP course or a promise of college credit. The instructor retains practical assessment and the published science rubric; integration is reported separately.
Prerequisites: Food-web arrows, population versus sample count, fractions and signed differences; separate correlation from a tested mechanism.
Suggested sequence: read and discuss the explanation; attempt the worked model; analyze the data at your selected level; check the answers; then complete the source-linked response and a fresh transfer question. These activities supplement, not replace, supervised practical work and the full-year schedule.
Assigned reading and focus
- OpenStax Biology 2e, 46.2: Energy Flow through Ecosystems. Read How Organisms Acquire Energy in a Food Web and Ecological Efficiency: The Transfer of Energy between Trophic Levels. Distinguish energy transfer from the recycling of atoms. Checked 2026-09-27.
- National Park Service, Yellowstone: Elk, Population and Elk on the Northern Range. Read Population and Elk on the Northern Range, including the abundance-graph caption about imperfect sightability. Locate the dated 1995, 2010, 2013, and 2022 winter counts; note hunting, drought, snow, migration, bears, cougars, and wolves. This living page was checked 2026-09-27; the table below fixes the values used in this assignment.
- Smith, Peterson, MacNulty and Kohl, The Big Scientific Debate: Trophic Cascades, NPS Yellowstone Science 24(1), 2016. Read the article body before Literature Cited. Compare top-down and bottom-up explanations, behavioral versus numerical effects, and site/water availability. Locate the discussion of Marshall, Hobbs and Cooper (2013); it is a cited study, not a 2013 date for this 2016 synthesis. Checked 2026-09-27.
- USGS Northern Prairie Wildlife Research Center, Yellowstone wolf restoration. Read the opening project summary: reintroduction in 1995 and 1996, diseases affecting wolves, and 46 wolf-pack study periods from 2004-2012. The response variable is wolf-elk encounter rate, not river shape or every cause of elk decline. Checked 2026-09-27.
Learn the science
Producers capture energy; consumers obtain it from food; decomposers process dead material from multiple trophic levels. Draw food-to-consumer arrows and a separate return path for nutrients. Matter cycles while energy flows and is dissipated as heat; a food web does not recycle energy indefinitely.
Wolves were reintroduced in 1995 and 1996. That is a historical intervention, not a randomized experiment in which wolves were the only changing factor. Distinguish northern-herd winter elk counts from park-wide summer abundance and northern-range wolf counts; dates and geographic boundaries matter.
NPS describes fewer elk and reduced browsing in some areas while discussing wolves, cougar and bear recovery, hunting, drought, snow, and migration. The count is not a complete census: sightability, snow cover, grouping and habitat can affect how many animals are seen.
Smith and colleagues' 2016 NPS synthesis compares behavioral and numerical top-down effects with water availability and beaver-related stream changes, citing Marshall, Hobbs and Cooper (2013). Willow height in existing stands is not the same response as area occupied, beaver abundance, or channel geometry.
USGS reports that elk density, among tested variables, influenced wolf-elk encounter rate in 46 wolf-pack study periods during 2004-2012. That narrow result does not show that snow never affects elk, or that wolves alone changed rivers. Population recovery, encounter rate, browsing, plant growth and river shape are different outcomes.

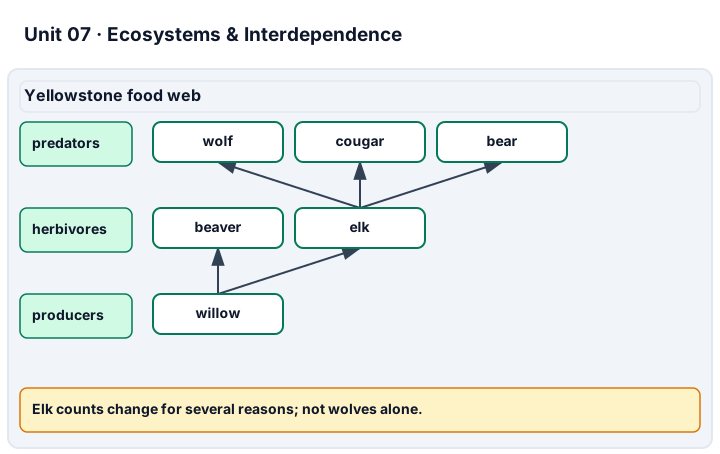
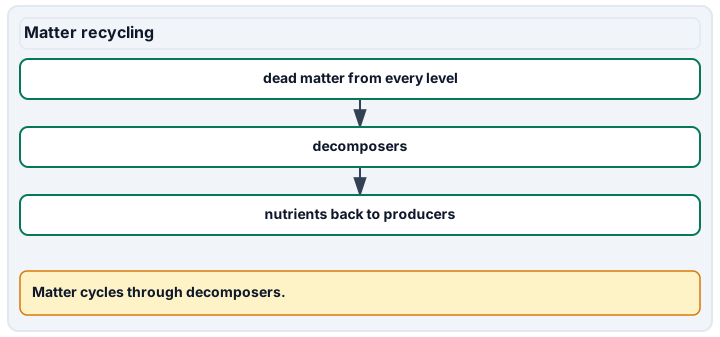
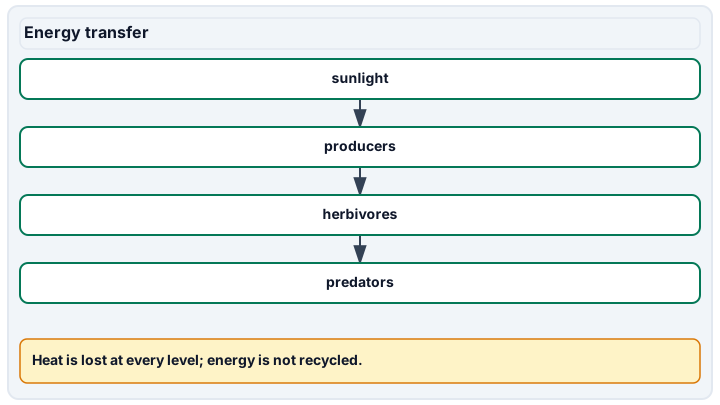
Diagram description
The Yellowstone food web uses eaten-to-eater arrows: willow feeds elk and beaver, and elk feed wolf, cougar, and bear. Elk counts can change for several reasons, not wolves alone. Dead matter from every level goes to decomposers, which return nutrients to producers. Energy begins with sunlight, moves through trophic levels, and dissipates as heat; transfer percentages use the supplied energy values.
Data, provenance, and assumptions
| Year | Population / boundary | Reported count | Precision or timing |
|---|---|---|---|
| 1995 | Northern-herd elk | 17000 | Approximately; beginning of reintroduction |
| 2010 | Northern-herd elk | 6070 | Final Gardiner Late Hunt year |
| 2013 | Northern-herd elk | 3915 | Early 2013 |
| 2022 | Northern-herd elk | 6673 | 2022 count |
| 2007 | Northern-range wolves | 94 | 2007 |
| 2015 | Northern-range wolves | 50 | End of 2015 |
| Water table | Browsing | Plot | Final height (cm) |
|---|---|---|---|
| Low | Allowed | L1 | 45 |
| Low | Allowed | L2 | 55 |
| Low | Excluded | L3 | 55 |
| Low | Excluded | L4 | 65 |
| Raised | Allowed | R1 | 85 |
| Raised | Allowed | R2 | 95 |
| Raised | Excluded | R3 | 170 |
| Raised | Excluded | R4 | 190 |
| Trophic level | Production (kJ per m^2 per year) |
|---|---|
| Producers | 1000 |
| Herbivores | 120 |
| Predators | 12 |
Worked model
Northern-herd elk counts changed from 3,915 in 2013 to 6,673 in 2022: +2,758, about +70.45% of the 2013 count. Do not line up the nonmatching 2007/2015 wolf counts as if they explain that interval. In the synthetic willow example, exclusion changes mean height from 50 to 60 cm at low water (+10), but from 90 to 180 cm at raised water (+90): the effect depends on water conditions. Producer-to-herbivore energy transfer is 120/1000 x 100 = 12%.
Numerical calibration
- 2758 more elk counted in 2022 than early 2013
- 70.45 % of the 2013 count, not a causal wolf effect
- 10 cm synthetic exclusion effect at low water
- 90 cm synthetic exclusion effect at raised water
- 80 cm difference between synthetic exclusion effects
- 12 % from producers to herbivores in the model
Attempt the assigned level
Try the tasks before reading the calibration. These are practice answers, not a secure examination; use a new dataset or changed assumption for the assessed transfer.
Foundation: typically grades 7-8
- Draw a food web with willow/grass -> elk, elk -> wolves, willow -> beavers, and dead material -> decomposers. Add sunlight, nutrients and heat without confusing energy and matter.
- Create a source ledger for NPS Elk, the 2016 debate article and the USGS project: author/institution, source date or access date, study dates, location, response measured, claim, and one limit. Use at least one exact count.
Check after your attempt
- Arrows carry food/energy toward consumers; nutrients return through decomposition. The listed web is simplified: it does not include every diet or mechanism.
- NPS counts describe northern-herd changes and count limits; the 2016 synthesis compares mechanisms; USGS concerns 2004-2012 encounter rates. A source about encounter rate cannot by itself establish a river-shape result.
Core
- Plot the four elk counts with actual year spacing and label 1995 approximate. Calculate the 2013-2022 change; annotate reintroduction, changing hunting, other predators, weather and observation limits without inventing their numerical effects.
- Calculate the four willow means and both browsing-exclusion effects. Write a claim comparing the same response under low and raised water, then explain why this synthetic model cannot estimate a Yellowstone river effect.
Check after your attempt
- 17,000 approximately; 6,070; 3,915; 6,673. The last interval increases 2,758 (70.45%). Counts do not identify a unique cause or correct for sightability.
- Means 50, 60, 90, 180 cm; exclusion effects +10 and +90 cm. This illustrates interaction, not measured Yellowstone recovery or proof that a single intervention reshaped channels.
Extension
- Compute the difference between the two exclusion effects. Propose an evidence comparison capable of separating water availability from browsing, specifying independent sites and the response variable.
- Compare the USGS encounter-rate claim with the NPS plant-recovery discussion. List measurements needed before making a river-geometry claim, and calculate the two energy-transfer percentages.
Check after your attempt
- 90 - 10 = 80 cm interaction in the synthetic model. Compare replicated water/browsing combinations with starting heights and repeated dates; do not treat repeated measurements of one site as independent sites.
- Encounter rate is not plant cover or channel shape. Seek dated browsing, water-table, flow/sediment, vegetation and channel measurements with comparable sites and weather. Transfers are 12% then 10%, not a universal fixed percentage.
History, reading, and writing connection
Original response: Write a 150-250 word evidence brief, or an equivalent annotated/audio brief, answering "What changed after wolf reintroduction, and what remains uncertain?" Compare the NPS and USGS claims with their dates, populations and response variables; use two specific count rows and the synthetic water/browsing contrast. Offer at least two plausible alternatives or interacting factors and an observation limit. End by naming evidence needed to test a river-shape claim. Do not conclude that wolves alone reshaped rivers, or that complexity means wolves had no effect.
Write in your own words or use an approved accessible equivalent. Cite a specific assigned section or figure, identify its evidence, and state one limitation or counterargument. Use the AI practice contract only for permitted coaching, never to invent observations or write the assessed response.
Transfer to a new case
Two photographs show taller willows beside a bend in a river, one before 1995 and one after. Can they establish that wolves alone moved the channel?
Calibration: No. Check location, date, season, scale, camera viewpoint, flood history, water table, browsing and land use. The photographs do not measure a controlled causal contrast or identify all changing processes.
Evidence to retain
Producers, consumers & decomposers: annotated roles. Food chains & food webs: directional network with beavers and decomposers. Energy flow: 12% and 10% calculations plus heat/matter distinction. Interdependence & change: dated count graph, source ledger, alternative mechanisms and water/browsing comparison. Lab technique (food-web modeling): separately observe the learner building and revising a model when a link or condition changes; supplied records are not field observations. Retain the brief and transfer with source/date, and score integration separately.
Record units, calculations, source/date, uncertainty, and what is measured versus inferred. A simulation or supplied dataset must stay labeled as such. This is reading, paper-model, and data work, not authorization to collect pond water, swab people, culture organisms, dissect, expose wildlife, or ingest study materials. Use only instructor-approved prepared slides, images, or in-room materials for separately observed practical skills. Supplied data are not your observations.
Return to all eight learning pathways. Print this unit page for the student lessons; the linked five-page packet remains the separate assessment companion.
Unit mastery rubric
| Criterion | Developing | Proficient | Mastery |
|---|---|---|---|
| Producers, consumers & decomposers | Can’t sort living things by how they get their food. | Names the roles but places some organisms wrong. | Sorts organisms into producers, consumers, and decomposers and explains each role. |
| Food chains & food webs | Thinks a food chain is about which animal is biggest. | Builds a straight food chain but not a connected web. | Builds a food web that shows how many food chains link together in an ecosystem. |
| Energy flow | Confuses energy flow with recycling matter. | Shows direction but omits units, transfer losses or heat. | Traces energy through a food web, calculates a supplied transfer percentage, and distinguishes heat loss from cycling matter. |
| Interdependence & change | Treats one before/after story as proof of a single cause. | Predicts a change but omits dates, alternative causes or count limits. | Uses dated evidence and interacting mechanisms to make a bounded ecosystem prediction with observation limits. |
| Lab technique (food-web modeling) | Builds a model that leaves out key organisms or links. | Builds the model but needs help revising a claim when conditions change. | Builds and revises a food-web model, distinguishing observed records, synthetic data and conditional predictions. |
| Integration (cross-domain) | Makes no supported connection between the source and the science. | Uses the source but needs help connecting evidence, writing, or limitations to the science. | Independently connects History, Reading, and Writing using a cited source, appropriate evidence, a limitation, and a scientific explanation. |
Integration is reported separately and cannot lower the science grade or block a science demonstration pass. Science and practical criteria determine that pass. Use the integration guide's evidence checklist for the separately reported criterion.
“Willow feeds elk, and elk feed wolves; nutrients can cycle, but energy is dissipated as heat. NPS counts rose from 3,915 northern-herd elk in 2013 to 6,673 in 2022. Predation, hunting, weather and count conditions may contribute. The synthetic willow comparison also depends on water table; it does not establish a wolf-only river effect.”
“A food chain is who’s biggest, so the hawk is on top. Energy is just there. I don’t think removing one animal would change much.”
Use the supplied Yellowstone records and paper food-web model; do not collect organisms or make an ecosystem-in-a-jar for this assignment. The instructor separately observes model-building and revision. Data analysis is not a field observation, and integration cannot block a science or practical pass.
A 5-page clipboard packet — unit overview, key terms, the mastery rubric, anchor examples, and a score sheet you can print and grade against.