Unit 06 · Uncertainty, Error & Honesty
Nine rows may contain only three independent samples. Group nested readings before summarizing uncertainty, retain inconvenient results and distinguish sensitivity analysis from a justified exclusion. A larger dataset can change the estimated variability rather than automatically making the result look more certain.
Student learning: Uncertainty, Error & Honesty
Choose the level by readiness, not age alone, and record it before instruction. Foundation, core, and honors tasks are study pathways, not an AP course or a promise of college credit. The instructor retains practical assessment and the published science rubric; integration is reported separately.
Prerequisites: Compute group means and ranges; core distinguishes a sample unit from a measurement; honors uses squares, square roots and n - 1.
Suggested sequence: read and discuss the explanation; attempt the worked model; analyze the data at your selected level; check the answers; then complete the source-linked response and a fresh transfer question. These activities supplement, not replace, supervised practical work and the full-year schedule.
Assigned reading and focus
- Lazic (2010), The problem of pseudoreplication in neuroscientific studies. Published methods analysis, not our sheet measurements. Read the Abstract, the Background explanation of independent samples versus repeated observations, and the Figure 1 caption. Apply the statistical distinction to our paper-sheet records only; no animal study is assigned. Our practice values are synthetic, not measurements taken from this source.
- NIST/SEMATECH e-Handbook, 1.3.5.6: Measures of Scale. Spread and distribution reference. Read the standard-deviation and range discussion and the cautions about distribution and extreme values. Use the supplied formulas rather than calling any spread a 95% interval. Our practice values are synthetic, not measurements taken from this source.
- Significance: The Semmelweis Effect: How many lives can hand hygiene save?. Historical numerical reference and retrospective statistical analysis. Read Table 1 and When you assume, especially the residual distribution, dependence over time and uncertainty discussion around Figure 2. Use the supplied historical numerical record rather than an unsupported story about personal motives. Table 1 reports historical admissions and deaths; the separate unit practice datasets remain explicitly synthetic.
Learn the science
Choose a pathway before instruction. Foundation typically supports grades 7-8 with guided tables and arithmetic; Core adds independent analysis; Extension adds explicit assumptions, models and critique. Readiness, accessibility and prerequisites govern placement. A scaffolded practice response is not automatic Mastery on every criterion.
The independent sampling unit determines what variation you have learned about. Subsamples within a sheet help describe that sheet; they do not become independently sampled sheets by appearing in separate rows. Calculate each sheet mean first when the question concerns typical sheets and the planned design weights sheets equally. Spread between sheet means describes variation among these sampled sheets. A standard error of their mean is a model-based summary, not the full uncertainty of the materials or the instrument.
Assumptions: Three fictional sheets are independently sampled from the stated batch. Each supplies three equal-area coupons tested under the same hypothetical water-retention rule; each value is a synthetic mass gain in grams, not a procedure to perform. Sheets are the independent units and coupons are subsamples. The equal-area and equal-sheet-weight assumptions are explicit. No known calibration bias is corrected by these data.
Uncertainty: There are three independent sheets and nine coupon readings, not nine independent sheets. Adjacent coupons may resemble one another. Even correctly grouped data from one batch do not describe all brands or batches. For honors, s = sqrt(sum((sheet mean - overall mean)^2)/(n - 1)) and SE = s/sqrt(n), assuming independent comparable sheets. SE is not a 95% confidence interval and omits possible systematic error.

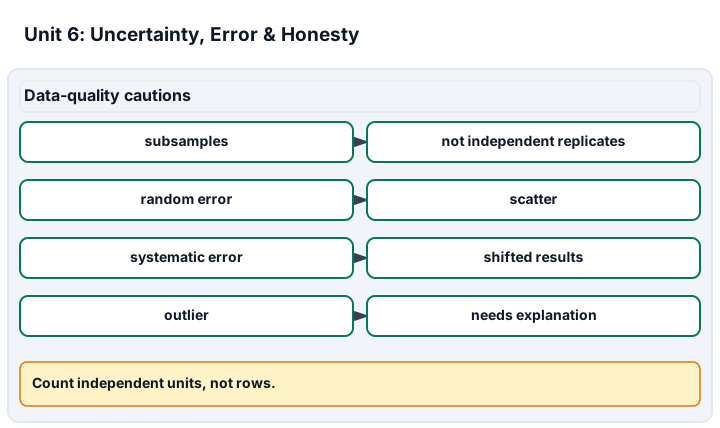
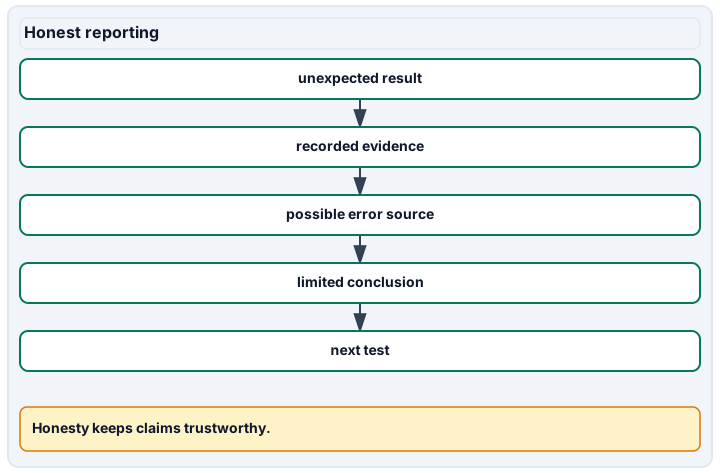
Diagram description
Data-quality cautions states subsamples are not independent replicates and describes random error, systematic error and outliers. Honest reporting keeps unexpected results in the record, considers error sources, limits conclusions and suggests next tests.
Data, provenance, and assumptions
| Sheet | Coupon | Mass gain (g) |
|---|---|---|
| S1 | a | 9 |
| S1 | b | 10 |
| S1 | c | 11 |
| S2 | a | 13 |
| S2 | b | 14 |
| S2 | c | 15 |
| S3 | a | 17 |
| S3 | b | 18 |
| S3 | c | 19 |
| Sheet | Coupon | Mass gain (g) |
|---|---|---|
| S4 | a | 21 |
| S4 | b | 22 |
| S4 | c | 23 |
Investigation design: Nine readings from three sheets are not nine sheets
Scope and safety: These are supplied-data and paper investigations, not laboratory procedures. An educator must approve any actual practice, materials, location, supervision, accessibility and emergency plan beforehand. Do not grow or open unknown cultures, handle unknown spills, use hazardous apparatus, test hygiene on people, or collect personal health disclosures. Paper work does not certify unobserved practical skill. Public worked answers are nonsecure practice, not private assessor items.
Materials and preparation
- Use the supplied nested-sheets, sheet-transfer records, assigned source sections, calculator and an accessible graph or diagram. No physical apparatus is required.
Procedure and schedule
- Question: How much independent evidence do nested readings contain, and what can honestly be said about uncertainty? Prerequisites: Compute group means and ranges; core distinguishes a sample unit from a measurement; honors uses squares, square roots and n - 1.
- Variables: Track sheet identity, coupon identity and mass gain. The outcome is coupon mass gain summarized per independent sheet, not a treatment comparison. Controls: The paper scenario assumes equal coupon area, common timing, common method and one batch. A real study must verify these conditions and calibration separately.
- Sampling and replication: Independently sampled sheets are replicates; coupons within a sheet are subsamples. New observations of the same coupon would be repeat readings, another distinct level.
- Analysis: Group before calculating uncertainty, compare raw and sheet-mean ranges, document exclusion sensitivity and recompute after one new independent sheet. Review: An educator reviews prerequisites, source interpretation, reasoning and accessibility before assessment. A paper response does not certify unobserved practical technique; approved hands-on work requires a separate record.
Record: Retain every row and ID, grouping decision, independent n, averaging weights, SD/SE formulas if used, bias limitations, sensitivity label, source/date and the fourth-sheet revision.
Worked model
Sheet means are (9 + 10 + 11)/3 = 10 g, (13 + 14 + 15)/3 = 14 g and (17 + 18 + 19)/3 = 18 g. Their mean is 14 g. The raw coupon range is 9-19 g; the sheet-mean range is 10-18 g, and these describe different levels. Sample SD of sheet means is sqrt((16 + 0 + 16)/2) = 4 g; SE = 4/sqrt(3) = 2.3094 g under the stated model. Omitting the whole highest sheet changes the mean to (10 + 14)/2 = 12 g. That sensitivity is worth reporting, not a reason to remove an inconvenient sheet without independent evidence of failure.
Numerical calibration
- 14 g; equally weighted sheet means
- 4 g; sample SD across three sheet means
- 2.3094010767585034 g; model-based SE, not a 95% interval
- 12 g; sensitivity calculation, not an authorized exclusion
- 16 g; four sheet means
- 2.581988897471611 g; four-sheet model-based SE
Attempt the assigned level
Try the tasks before reading the calibration. These are practice answers, not a secure examination; use a new dataset or changed assumption for the assessed transfer.
Foundation: typically grades 7-8
- Group coupons by sheet, calculate three sheet means and report both the raw-reading range and sheet-mean range. Explain why the largest reading should remain in the record even if someone calls it an outlier.
Check after your attempt
- Sheet means are 10, 14 and 18 g, averaging 14 g. Coupon values range 9-19 g; sheet means range 10-18 g. The 19 g coupon is the largest, not automatically erroneous. Keep its ID and value; request documented equipment or protocol evidence before excluding anything from an analysis.
Core
- Identify independent replicates and subsamples. Compare the mean with and without S3, then explain why a calculation that treats every coupon as an independent sheet overstates the information. Name one random and one systematic source of variation.
Check after your attempt
- The independent units are three sheets; the nine coupons are nested subsamples. The full mean is 14 g and without S3 it is 12 g. Report both only as a labeled sensitivity check, retaining S3 unless a pre-agreed, evidence-backed exclusion applies. Random local variation can change coupons; a balance offset can shift all readings. Extra coupons cannot remove a shared offset or substitute for more independent sheets.
Extension: choose by prerequisites, not age alone
- Use the supplied sample-SD and SE formulas on sheet means, stating n and units. Why is mean plus or minus SE not a universal uncertainty interval? Predict whether a genuinely new, unusually high sheet must reduce the observed SE.
Check after your attempt
- n = 3, sample SD = 4 g and SE = 4/sqrt(3) = 2.3094 g, about 2.3 g. This estimates sampling variability of the mean under independence, not a 95% interval or all measurement uncertainty. A new sheet can raise observed between-sheet variation enough that SE increases, even though the formula divides by sqrt(n). More data need not make every estimate look more certain.
History, reading, and writing connection
Write a source-linked paragraph comparing the historical Table 1 rates and the residual counterevidence discussed in When you assume with uncertainty in the nested-sheet exercise. Explain why clinic-months may be dependent and why coupons are not independent sheets. Retain inconvenient observations, state model and causal limits, and cite the source's numerical evidence and uncertainty discussion. Historical records support an evidence-based interpretation, not claims about embarrassment, friendships or reputation without separate historical evidence.
Write in your own words or use an approved accessible equivalent. Cite a specific assigned section or figure, identify its evidence, and state one limitation or counterargument. Use the AI practice contract only for permitted coaching, never to invent observations or write the assessed response.
Transfer to a new case
Add sheet-transfer as one new independent sheet. Recompute the overall mean and, for honors, SE from the four sheet means. Did observed uncertainty necessarily shrink? Explain what stays in the record.
Calibration: S4 averages 22 g, so sheet means 10, 14, 18, 22 average 16 g. Their squared deviations total 80 g^2; sample SD = sqrt(80/3) = 5.1640 g and SE = 5.1640/2 = 2.5820 g, higher than 2.3094 g. The new variability increased the estimate. Keep all sheets, both analysis versions and the unchanged independence assumptions; do not suppress S4 to make the result look precise.
Evidence to retain
Retain raw coupon IDs, the sheet-grouped analysis, ranges, sensitivity calculation and explicit limits. Honors adds the shown SD/SE reasoning, not a more certain practical certificate. These support the five error/honesty criteria as data analysis; any performed repeat-measurement task needs its own observation record. Required Writing includes why an inconvenient value is evidence rather than a moral failure.
Record units, calculations, source/date, uncertainty, and what is measured versus inferred. A simulation or supplied dataset must stay labeled as such. These are supplied-data and paper investigations, not laboratory procedures. An educator must approve any actual practice, materials, location, supervision, accessibility and emergency plan beforehand. Do not grow or open unknown cultures, handle unknown spills, use hazardous apparatus, test hygiene on people, or collect personal health disclosures. Paper work does not certify unobserved practical skill. Public worked answers are nonsecure practice, not private assessor items.
Return to all eight learning pathways. Print this unit page for the student lessons; the linked five-page packet remains the separate assessment companion.
Match evidence to the actual criterion
Integration is reported separately and cannot lower the science grade or block a science demonstration pass. Science and practical criteria determine that pass.
Assess the grouping, uncertainty label, exclusion reasoning and response to new evidence. Supplied-data analysis does not certify that the learner performed repeated measurements. The educator reviews actual collection separately, with approved accommodations and the published reassessment policy unchanged.
- Science 1: Sources of error. Distinguish coupon variation, between-sheet variation and a shared calibration bias.
- Science 2: Repeat trials & spread. Report independent-unit count and ranges at the correct level of replication.
- Science 3: Reporting uncertainty. Label spread or SE with units, assumptions and what uncertainty it does not include.
- Science 4: Anomalies & outliers. Keep the highest sheet and document sensitivity without silently excluding it.
- Science 5: Intellectual honesty. Revise the estimate when a fourth sheet changes the mean and observed uncertainty.
Source, data, task and review inventory. Retain the selected level, first attempt, source/date, assumptions, correction and a fresh transfer. Do not reuse public answers as secure assessor items.
Unit mastery rubric
| Criterion | Developing | Proficient | Mastery |
|---|---|---|---|
| Sources of error | Blames “human error” for everything, or can’t say where a measurement might go wrong. | Names a source of error but can’t tell whether it scatters results randomly or pushes them all one way. | Names random variation and possible systematic bias at the correct level; explains why averaging cannot remove every error. |
| Repeat trials & spread | Measures once and treats that single number as the truth. | Repeats the trial but ignores how much the results differ from each other. | Reports independent units separately from repeat readings or subsamples, with means and spread at the appropriate level. |
| Reporting uncertainty | Reports a lone number as if it were exact. | Admits the measurement isn’t perfect but can’t attach a range to it. | Reports a value with units and a justified uncertainty summary, explaining its assumptions and what it does not include. |
| Anomalies & outliers | Quietly erases a point that doesn’t fit, or never notices it. | Spots an odd point but drops it with no reason, or keeps it without a second look. | Retains anomalies and sources, documents any justified exclusion and distinguishes sensitivity analysis from silent deletion. |
| Intellectual honesty | Changes numbers or the hypothesis to make the results “come out right.” | Reports the real result but calls the experiment a failure because it disproved the guess. | Reports conflicting results and revises the claim honestly; does not alter observations or relabel uncertainty to rescue a prediction. |
| Integration (cross-domain) | Makes no supported connection between the source and the science. | Uses the source but needs help connecting evidence, writing, or limitations to the science. | Independently connects History, Reading, and Writing using a cited source, appropriate evidence, a limitation, and a scientific explanation. |
Integration is reported separately and cannot lower the science grade or block a science demonstration pass. Science and practical criteria determine that pass. Use the integration guide's evidence checklist for the separately reported criterion.
There are three independent sheets, not nine. Sheet means are 10, 14 and 18 g, averaging 14 g. Removing the highest sheet would give 12 g, but I have no source-backed reason to exclude it. I retain both the data and the labeled sensitivity check.
Nine coupons means nine independent sheets. I dropped the highest one because it made the uncertainty look worse.
Assess the grouping, uncertainty label, exclusion reasoning and response to new evidence. Supplied-data analysis does not certify that the learner performed repeated measurements. The educator reviews actual collection separately, with approved accommodations and the published reassessment policy unchanged.
A 5-page clipboard packet — unit overview, key terms, the mastery rubric, anchor examples, and a score sheet you can print and grade against.